
A cryptocurrency makes a new high.
Then another.
And another.
The trend looks beautiful on a chart. Higher highs, higher lows, little hesitation. Every pullback appears to attract fresh demand.
But somewhere along the way, the movement starts changing.
The next breakout gains only 2%. The one after that manages barely 1%.
Pullbacks become deeper, and the market takes longer to recover.
Price is technically still making new highs.
Yet something about the trend no longer feels the same.
This is where analyzing follow-through becomes particularly useful.
An uptrend can weaken without ending
A common mistake in technical analysis is thinking that a market must be either bullish or bearish.
In reality, trends can pass through different stages.
An asset may begin with aggressive buying, wide-ranging bullish candles and relatively shallow retracements.
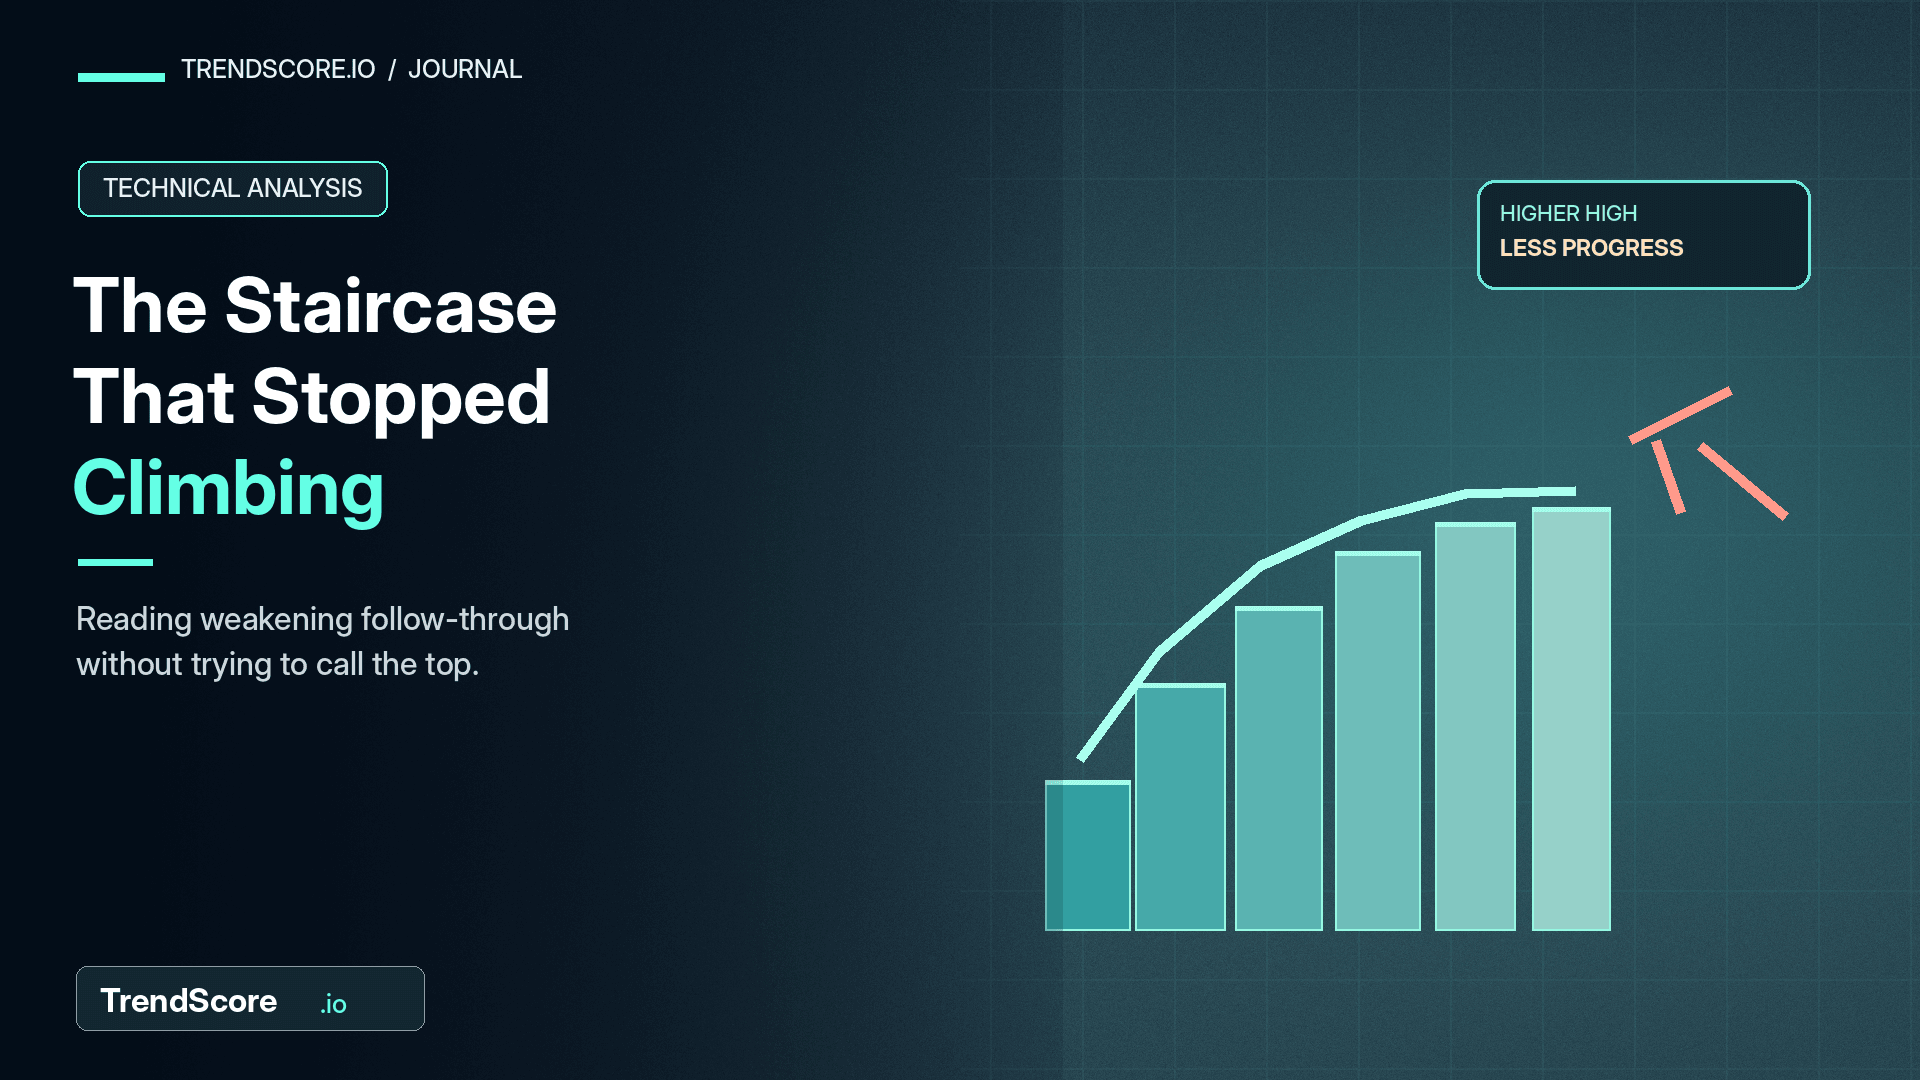
As the movement matures, price can continue advancing while each new rally becomes less decisive.
For example, imagine a hypothetical cryptocurrency producing the following sequence of swing highs:
$100, $108, $114, $117 and $118.50.
Every new high remains above the previous one.
The basic bullish structure is technically intact.
But notice what has changed.
The advances between highs have become progressively smaller.
If the pullbacks are simultaneously becoming larger, the relationship between upward progress and downward movement is deteriorating.
That doesn't prove a reversal is coming.
It does suggest that the trend is no longer progressing with the same efficiency.
Think about the distance travelled
One way to evaluate follow-through is to compare the size of advances with the size of subsequent retracements.
Suppose an asset rallies $10 and then pulls back $2.
The advance is substantial relative to the decline.
Later, the market rallies $4 but pulls back $3.50.
The price is still making progress, but the trade-off has changed considerably.
Buyers are achieving less upward movement before sellers regain control.
A trader observing this pattern might reasonably become more cautious about entering late in the trend.
The issue is not whether the asset can continue rising.
It may.
The issue is whether the current conditions still justify the same assumptions used earlier in the movement.
Why one weak breakout isn't enough
Markets don't advance at a constant speed.
Even healthy trends experience consolidation, profit-taking and temporary momentum loss.
A single disappointing breakout could simply represent ordinary market noise.
This is why follow-through should be evaluated as a developing pattern rather than an isolated candle.
Does price repeatedly struggle to maintain new highs?
Are successive rallies becoming shorter?
Do pullbacks consistently erase a larger proportion of the preceding advances?
Is volume behaving differently during rallies and declines?
And how does the pattern compare with the asset's usual volatility?
A narrow advance during low-volatility conditions may have a different interpretation from a narrow advance accompanied by unusually aggressive selling.
Context determines whether the observation is meaningful.
Momentum indicators can help—but don't settle the question
Traders sometimes use RSI or MACD divergence to identify weakening trends.
For example, price might establish a new high while RSI fails to exceed its previous peak.
That creates a bearish momentum divergence.
It can be a useful warning that the strength of the move is changing.
But divergence is not a reliable countdown to reversal.
Strong markets can continue making new highs while momentum indicators diverge for extended periods.
Selling simply because an indicator shows divergence can be expensive.
The more useful approach is to treat momentum weakness as one piece of evidence, then examine whether market structure begins confirming the change.
The difference between slowing down and turning around
Imagine a car climbing a hill.
It begins at 80 kilometres per hour and gradually slows to 50.
The car is still travelling uphill.
Its speed is declining, but its direction hasn't changed.
A market behaves similarly.
Weakening momentum describes a change in the rate or quality of movement.
It does not automatically describe a change in direction.
For a structural reversal, traders generally want evidence that the existing pattern of higher highs and higher lows has materially deteriorated.
Perhaps price fails to establish another high.
Perhaps an important higher low breaks.
Perhaps the next recovery attempt forms a lower high.
Those developments can carry greater structural significance than simply observing reduced momentum.
What this means for trade management
Recognizing weaker follow-through can influence several decisions.
A trader considering a new LONG position may become more selective about the entry.
Someone already holding a profitable position may review whether the original trade-management rules remain appropriate.
Another trader may decide to avoid initiating a SHORT until stronger reversal evidence appears.
These responses aren't contradictory.
They reflect different objectives and risk profiles.
The important point is to avoid transforming an observation about weakening momentum into an unjustified prediction of an immediate collapse.
A more useful measure of trend quality
At TrendScore, market direction is only part of evaluating a potential setup.
The quality of the movement matters too.
Two assets can both be bullish, yet one may demonstrate orderly continuation while the other struggles to maintain new highs.
The difference can affect entry quality, stop placement and potential reward.
A scanner or research framework can examine these characteristics systematically, but their actual predictive usefulness must be tested rather than assumed.
A trend does not have to reverse to become less attractive. Sometimes it simply stops rewarding each additional step forward as generously as it did before.