

Why volatility compression deserves attention.
Traders naturally notice large candles.
A cryptocurrency suddenly rises 8%, volume surges and the chart begins appearing across social media.
Within minutes, traders are debating whether the move has another 10% left.
But there's a less glamorous situation that deserves attention.
Sometimes the most interesting development occurs before the dramatic movement, while price is doing almost nothing.
Candles become smaller. Daily or hourly ranges narrow. Volatility declines, and the market appears to be drifting without much purpose.
This is known as volatility compression.
Understanding it can help traders recognize when the character of a market is changing, even before a clear directional move develops.
What exactly is volatility compression?
Volatility compression describes a period when price movements become progressively smaller relative to their recent history.
Imagine a cryptocurrency that normally fluctuates between $9.50 and $10.50 during a trading session.
Over the following days, its trading range gradually narrows.
First, price fluctuates between $9.70 and $10.30.
Then between $9.85 and $10.15.
Eventually, the asset spends several hours moving between $9.95 and $10.05.
The market has become increasingly compressed.
This may reflect temporary balance between buyers and sellers, reduced trading interest or participants waiting for new information.
The important detail is that price is becoming less volatile.
It doesn't necessarily mean the next movement will be bullish.
And it certainly doesn't guarantee an explosive breakout.
Why traders compare compression to a spring
The classic analogy is a compressed spring.
The tighter the spring becomes, the more energy appears to be building.
In financial markets, the analogy is useful for visualization but imperfect in practice.
A mechanical spring stores physical energy.
A trading range does not.
Low volatility can persist for much longer than traders expect, and a narrow range may be followed by another narrow range rather than a dramatic movement.
What makes compression interesting is that volatility often changes between quieter and more active regimes.
A market that has been unusually quiet may eventually experience a meaningful increase in trading activity and price movement.
The challenge is recognizing that transition without assuming its direction.
How to measure compression
Several common technical tools can help identify declining volatility.
Average True Range (ATR) measures the magnitude of recent price movement.
When ATR declines, the market's recent trading ranges are generally becoming smaller.
Bollinger Band Width measures the distance between the upper and lower Bollinger Bands relative to the middle band.
A narrowing band width indicates that price dispersion is decreasing.
Traders can also examine the size of recent candles, the range between local highs and lows, and changes in realized volatility.
For meaningful comparisons, measurements should be considered relative to the asset's price and historical behaviour.
A $100 cryptocurrency and a $0.10 cryptocurrency cannot reasonably be compared using absolute ATR values alone.
An asset's volatility relative to its own recent history is often more informative.
Compression isn't a trading direction
One of the biggest mistakes is assuming that low volatility automatically predicts an upward breakout.
Suppose a market has consolidated within a narrow range for several hours.
Buyers may eventually overwhelm sellers and push price higher.
But sellers can also gain control and trigger a downward move.
Sometimes price briefly moves in one direction before reversing sharply.
Compression identifies a potentially interesting change in market conditions.
It doesn't reveal which side will win.
That distinction is particularly important for leveraged traders, who may be tempted to enter early simply because a market appears ready to move.
The first breakout may not be the real one
A narrow trading range can attract orders around its boundaries.
Some traders place stop orders beyond recent highs and lows.
Others enter when price crosses a defined resistance or support level.
When the market initially breaks out, these orders can contribute to a quick movement.
But an early breakout may fail.
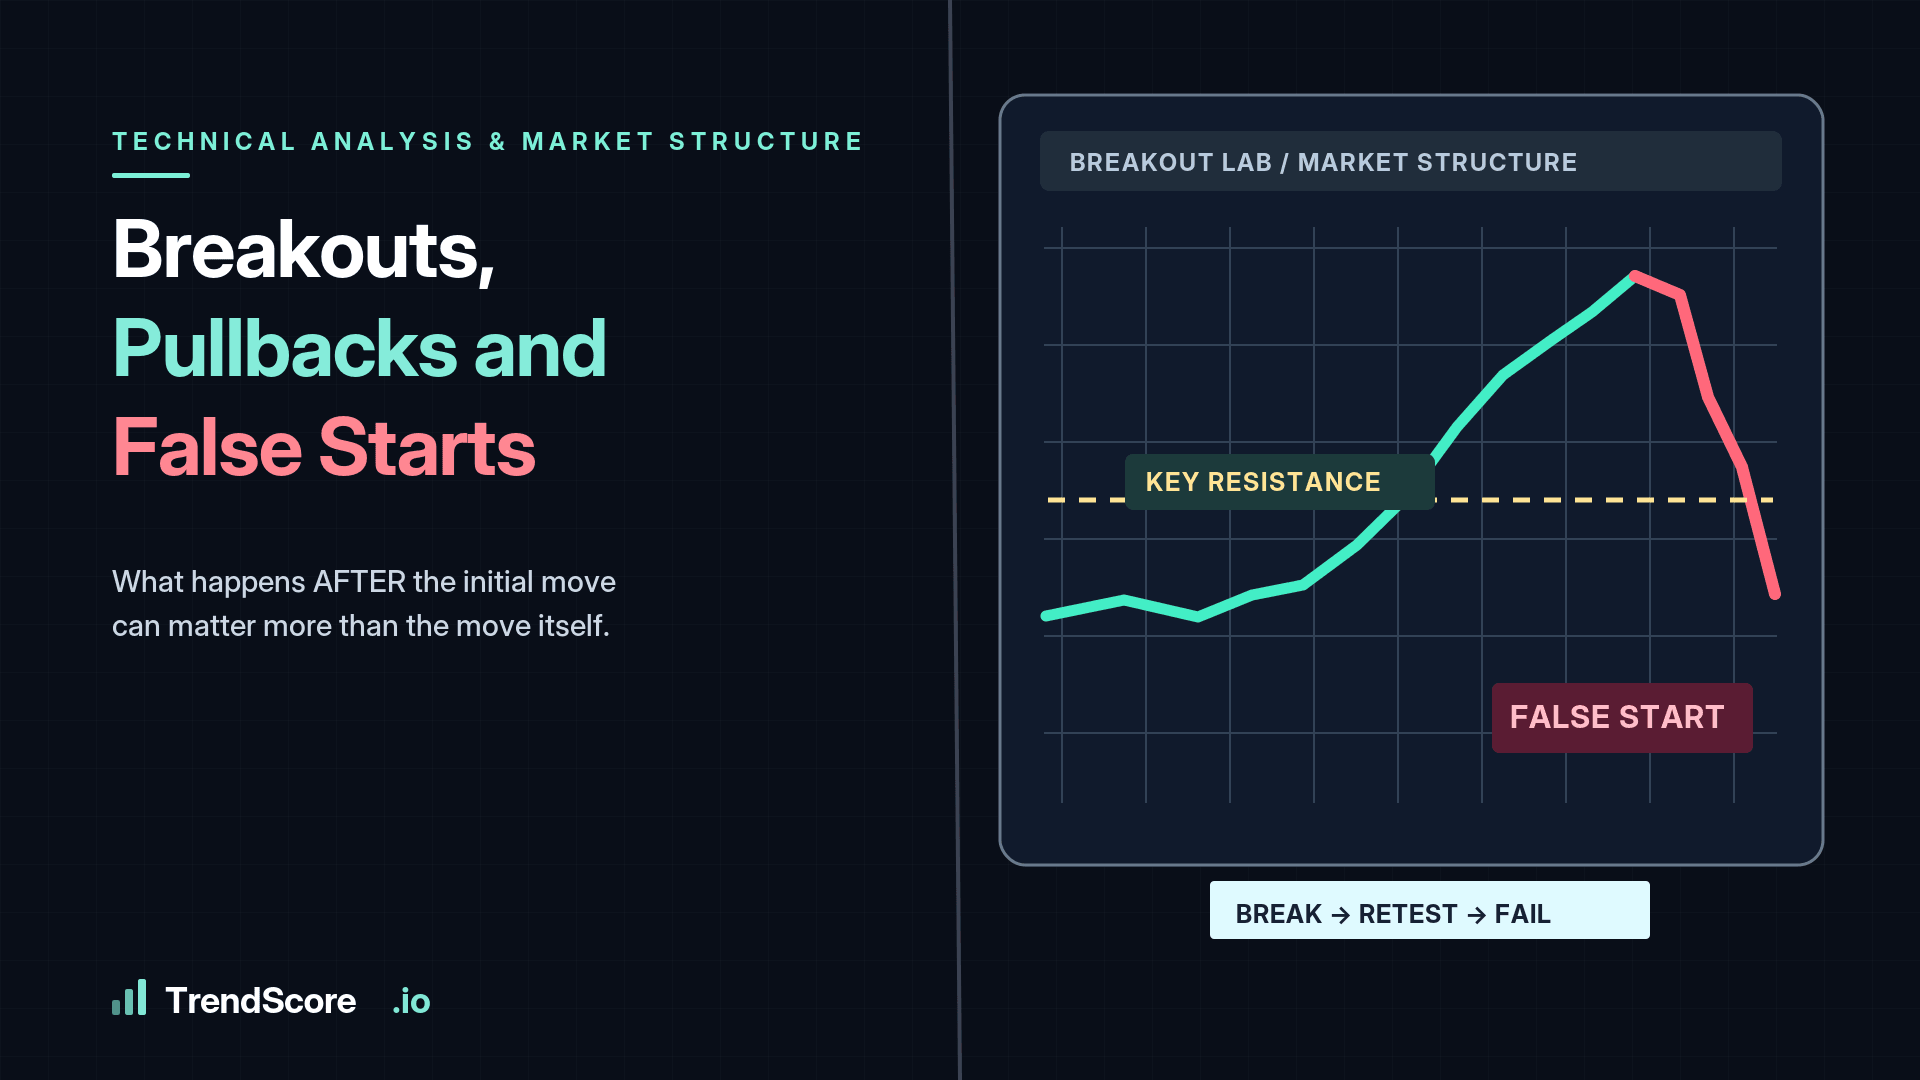
Price might briefly move above resistance, trigger breakout entries and then fall back into the range.
A similar event can occur below support.
This is why the initial candle should be evaluated alongside subsequent market behaviour.
Does the price remain outside the previous range?
Does trading activity increase?
Is there meaningful follow-through?
Does the broader timeframe support the direction of the move?
Waiting for additional evidence can reduce some false entries, although it may also result in missing a genuine fast breakout.
There is always a trade-off.
Volume adds context, not certainty
Compression often coincides with declining trading activity, but the relationship is not universal.
A market can trade actively while remaining within a narrow range if buying and selling pressure are balanced.
When volatility expands, increasing volume may indicate that more participants are becoming involved.
However, strong volume does not guarantee continuation.
A breakout accompanied by substantial activity can still fail if opposing orders absorb the movement.
The most useful interpretation comes from examining volume, price behaviour and market structure together.
The real advantage is having a plan beforehand
Imagine identifying a well-defined consolidation range before price breaks out.
You can examine the upper and lower boundaries.
You can determine what would qualify as a genuine change in structure.
You can establish conditions under which a potential trade would become invalid.
And you can calculate whether an entry would offer acceptable reward relative to the required risk.
This preparation matters.
Once a fast breakout begins, decisions become more emotional.
Traders feel pressure to participate immediately, often without evaluating whether the available entry still makes sense.
Studying compression beforehand can help replace that urgency with a conditional plan.
An opportunity worth measuring
At TrendScore, the relationship between momentum, volatility and market structure is central to understanding potential trading scenarios.
One worthwhile research question is whether particular combinations of declining volatility and improving momentum produce meaningfully different outcomes from ordinary breakout setups.
Answering that requires historical observations, realistic trading assumptions and testing across multiple market environments.
Compression itself is not an edge simply because it appears on a chart.
But it is a useful condition to identify, monitor and study.
The biggest candle attracts attention. The quieter period before it may offer the better opportunity to prepare.