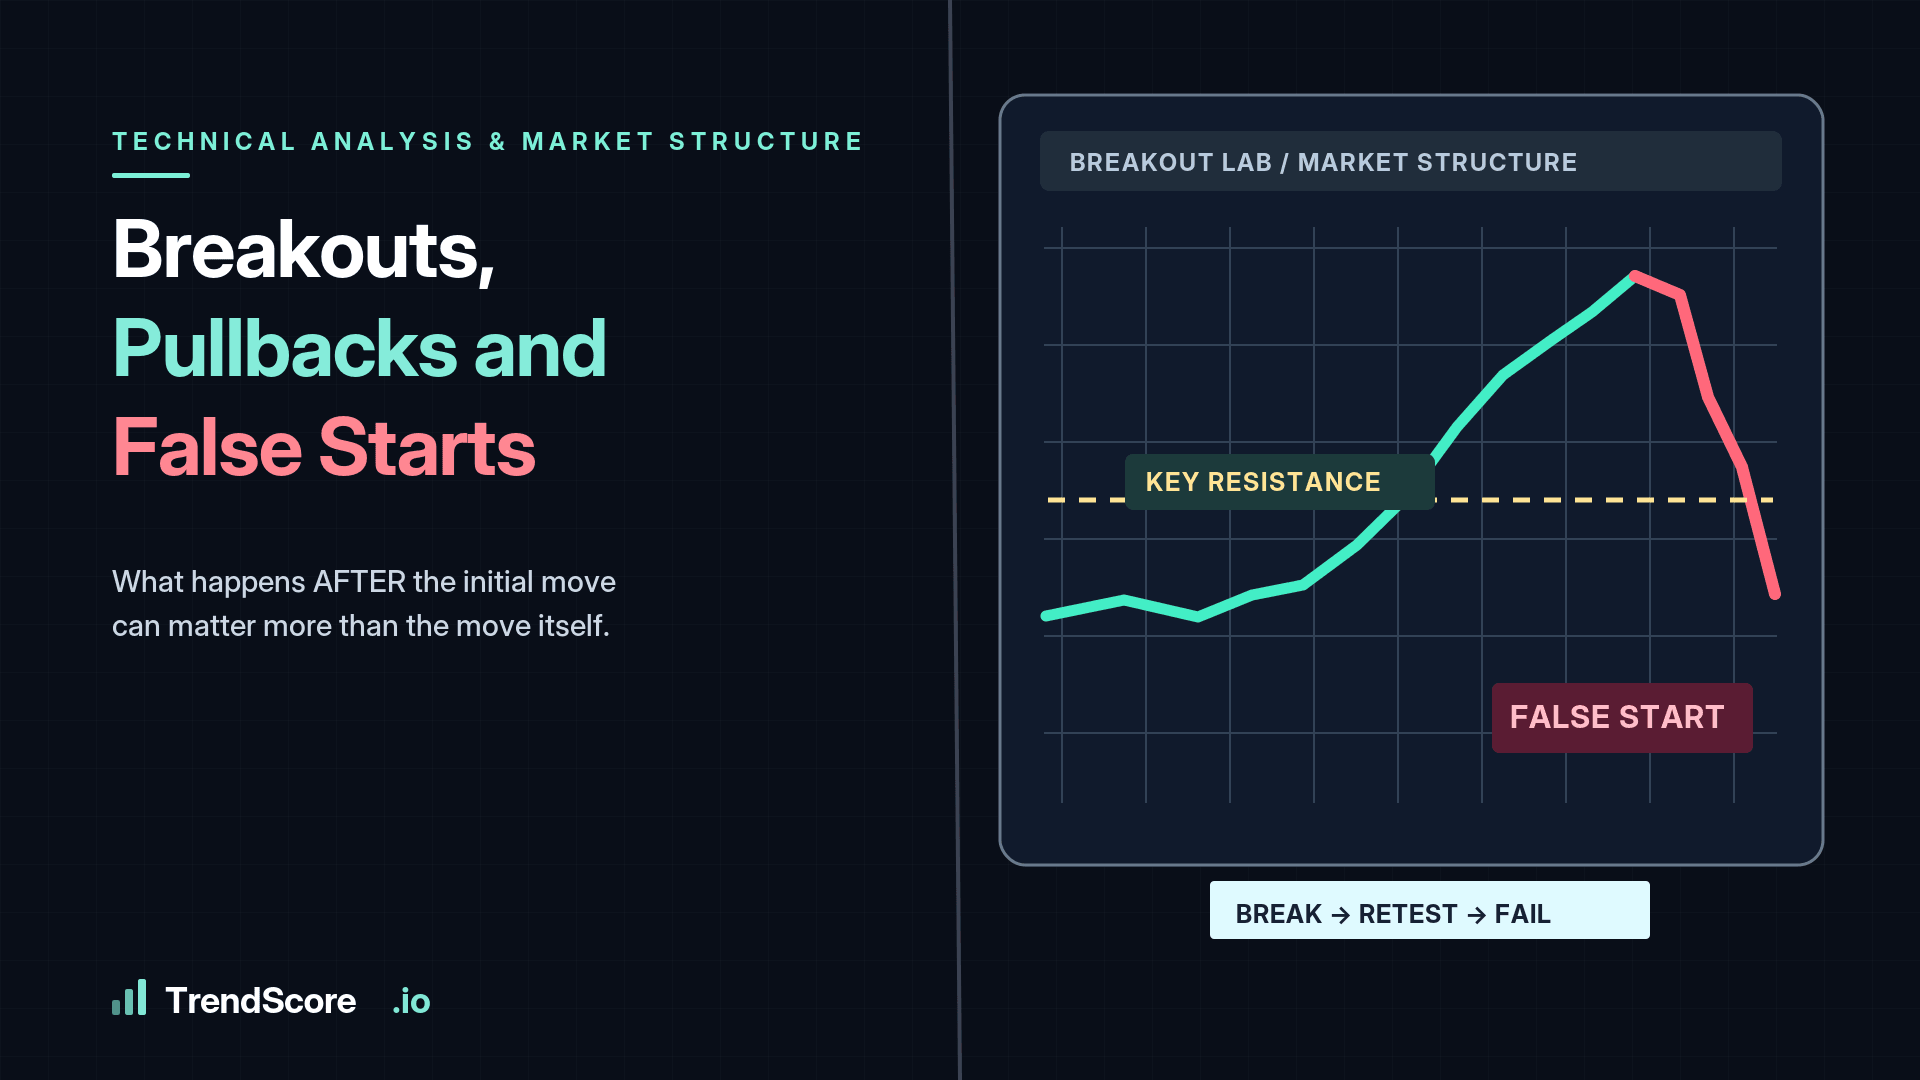


Why fast, emotional markets can overwhelm even the cleanest technical levels.
Open almost any technical analysis tutorial and you'll encounter the same familiar concept.
Support is where buyers may appear.
Resistance is where sellers may emerge.
Draw the relevant levels, observe how price reacts, and use those areas to help construct a trade.
The principle is useful.
But there's a problem with the way support and resistance are sometimes presented.
They can begin to look like permanent features of the market, almost as though a horizontal line on a chart possesses some natural authority over price.
It doesn't.
Support and resistance are observations about previous trading behaviour. Their relevance depends on what participants are willing to do when price approaches those areas again.
And that willingness can change very quickly.
A Price Level Is a Memory, Not a Wall
Suppose Ethereum repeatedly fails to move above a hypothetical resistance area around $3,000.
Each time price approaches that region, selling pressure appears.
Traders begin recognizing the level. Some place sell orders near it. Others take profits from existing LONG positions.
Over time, the area becomes widely watched.
But imagine an unexpected event causes a substantial increase in demand.
Buyers begin entering aggressively, and available sell orders near $3,000 are absorbed.
Price moves through the level and continues higher.
The resistance did not somehow malfunction.
The balance between buyers and sellers changed.
A technical level only matters when actual market participation gives it relevance.
Why Some Levels Break So Easily
There are several reasons an apparently strong level may fail.
One is a genuine change in supply and demand.
Another is an unexpected increase in volatility.
A third is liquidity.
Consider a market with a relatively thin order book near an important support level.
Price begins falling, and resting buy orders absorb some of the initial selling pressure.
But if sellers continue entering aggressively while buyers withdraw their orders, available liquidity may disappear.
Price can then move rapidly through the area that previously looked supportive.
This can happen during market-wide declines, sudden news events or large liquidation cascades.
It can also happen in ordinary trading conditions when the market's order flow changes sufficiently.
The lesson is not that technical levels should be ignored.
It's that their reliability cannot be evaluated separately from the surrounding market.
Why a Brief Break Doesn't Always Mean Failure
Another complication is that price can temporarily move beyond a level and then reverse.
Suppose a market has repeatedly found support near $100.
During a sudden downward move, price touches $98.50 before recovering to $102.
Was support broken?
The answer depends on how the strategy defines a break.
Some traders require a candle close below the level.
Others consider the depth and duration of the move.
Some use a price zone rather than a single exact number.
And certain strategies deliberately look for temporary breaks that fail to produce further selling.
These are sometimes called liquidity sweeps or failed breakdowns.
The important point is that a price briefly moving beyond a level does not always establish that the market has accepted a new trading range.
A temporary excursion and a sustained structural breakdown are different events.
Volatility Changes the Meaning of Distance
Imagine a market where the average daily trading range is approximately 2%.
A move of 1.5% through an established level might be significant.
Now imagine volatility has expanded so much that typical daily ranges reach 8%.
The same 1.5% movement may now represent ordinary market fluctuation.
This is one reason volatility indicators such as Average True Range can be useful.
ATR does not predict direction.
It helps estimate the magnitude of recent price movement.
Traders can use that information to evaluate whether a stop or invalidation level is reasonable relative to current market conditions.
A price threshold that made sense during calm trading may be far too sensitive after volatility expands.
The Difference Between Testing and Accepting a Level
A particularly useful concept is market acceptance.
When price moves beyond an important level, does it remain there?
Does trading activity continue in the new range?
Do attempts to return below a broken resistance level repeatedly fail?
Or does price immediately reverse and return to the previous trading area?
These observations can provide more information than the initial breakout itself.
For example, a market that moves above resistance, holds the new range and establishes higher lows may demonstrate stronger acceptance than one that briefly breaks upward before collapsing back into consolidation.
Neither outcome guarantees what happens next.
But the behaviour following the break helps establish context.
Why Timeframes Matter
A resistance level on a five-minute chart may be relatively insignificant on a daily chart.
A sharp intraday breakout can occur entirely within a larger weekly consolidation.
This creates situations where two traders appear to disagree while examining the same asset.
The short-term trader sees bullish momentum.
The longer-term trader sees price approaching an important supply area.
Both interpretations can be reasonable.
Understanding the timeframe associated with each level prevents traders from confusing a small structural change with a major trend reversal.
Think in Zones, Not Perfect Lines
Real markets are rarely precise enough to respect every horizontal line to the decimal place.
Many traders therefore work with areas of interest rather than absolute prices.
A support zone might extend from $98 to $101 instead of being defined exclusively at $100.
The appropriate width should reflect the asset's volatility, trading history and timeframe.
But this flexibility has limits.
A support zone should not be widened indefinitely merely to avoid acknowledging that an analysis has failed.
The zone must still provide a meaningful boundary for the trading hypothesis.
What Matters Most Is the Reaction
At TrendScore, technical structure forms part of a broader framework for examining potential trading scenarios.
An attractive price level becomes more informative when considered alongside momentum, volatility and defined risk.
A well-positioned support level cannot guarantee a successful LONG trade.
An established resistance area cannot guarantee a profitable SHORT.
And a clean breakout cannot guarantee continuation.
These are areas where traders should pay attention to what the market is doing.
Support and resistance don't stop mattering because markets become unpredictable. They lose their influence when the underlying buying and selling behaviour that created them changes.
The lines remain on the chart.
The market's willingness to respect them is what traders must continue evaluating.