

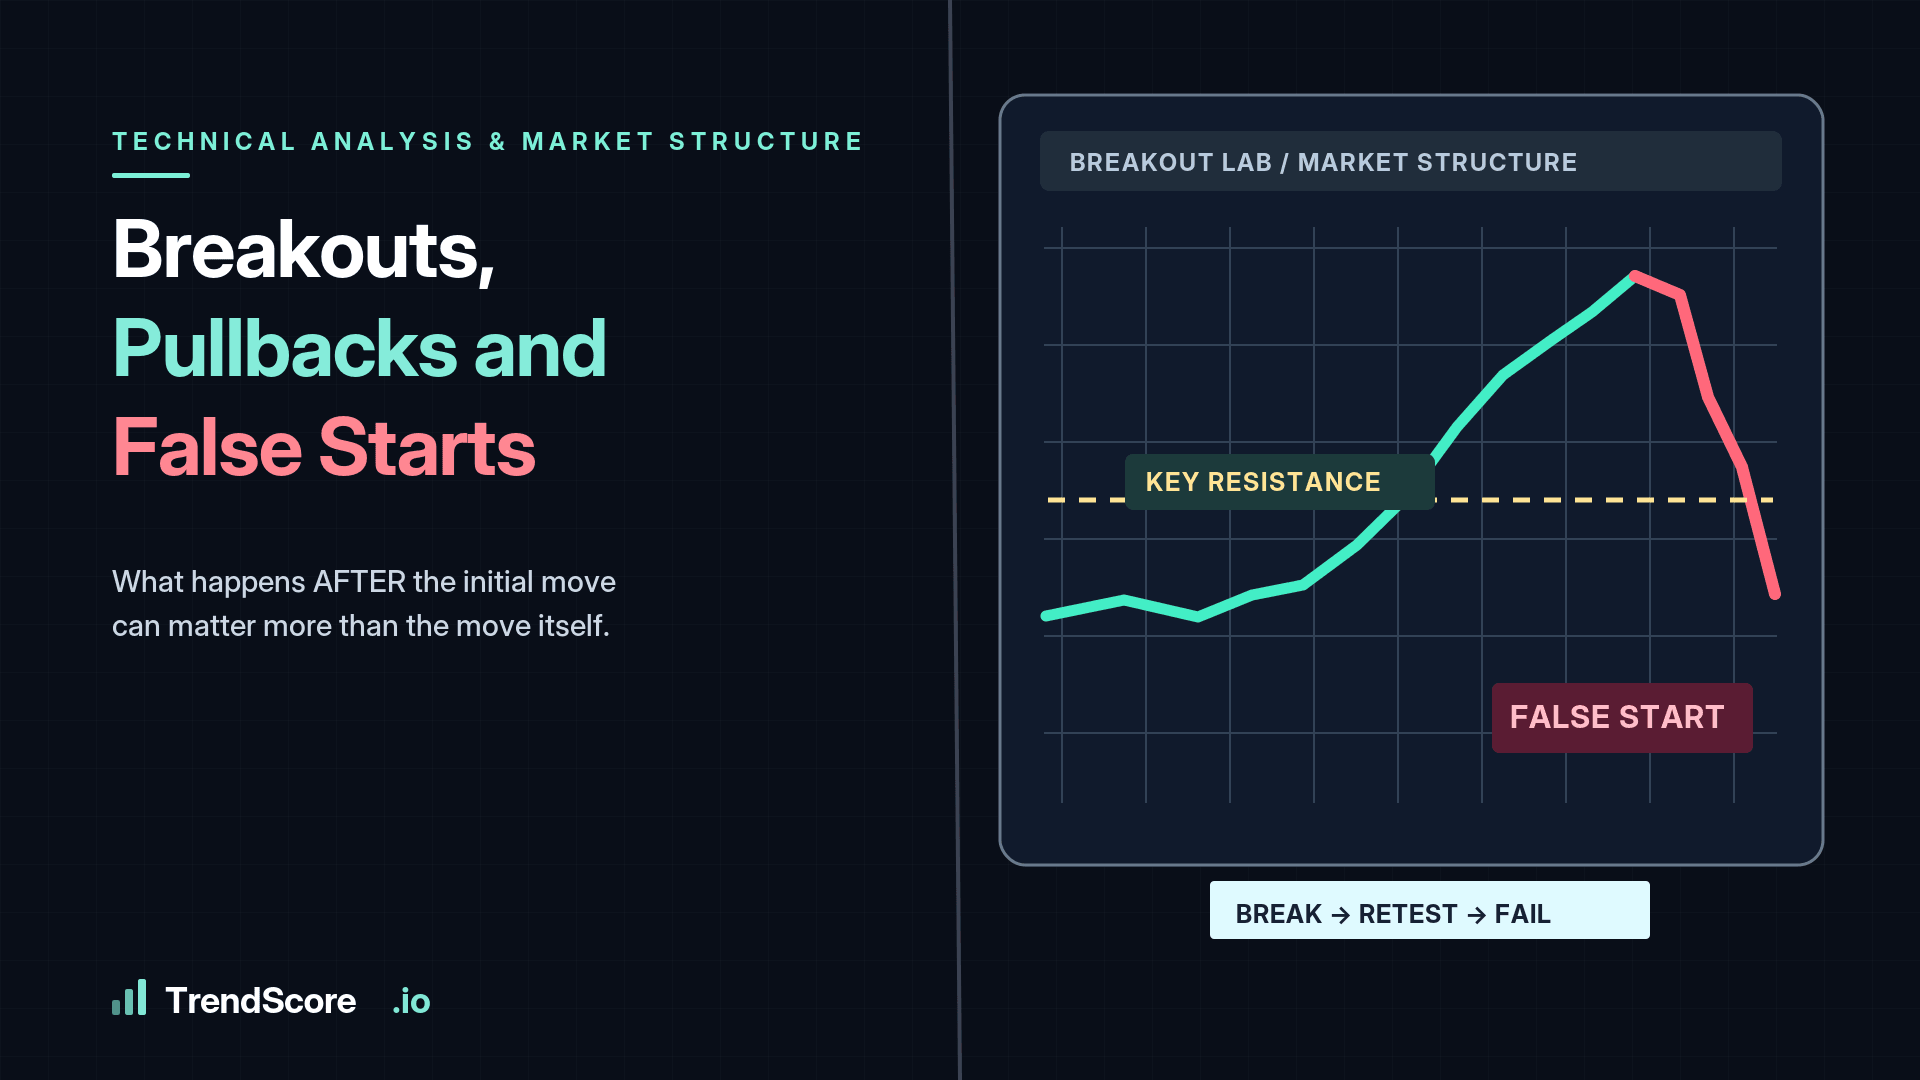
Why the reaction to a breakout can reveal more than the breakout itself.
Few events attract as much attention among technical traders as a price breaking through an established resistance level.
The chart suddenly looks different.
A price that struggled below $100 for several days is now trading at $103. Momentum indicators turn positive, volume begins increasing and traders start projecting higher targets.
It feels as though something important has changed.
Sometimes it has.
But one of the most valuable lessons in technical analysis is that the first move through a level doesn't always tell the complete story.
What happens afterward can be equally important.
A Breakout Is an Event, Not a Guarantee
Resistance levels often develop because buyers have repeatedly struggled to push price through a particular area.
When price finally breaks above that region, it can suggest that demand has become strong enough to absorb the available selling pressure.
However, crossing a level doesn't guarantee that buyers will maintain control.
Some breakouts continue immediately.
Others return to test the previous resistance area.
And some fail completely, sending price back into its earlier trading range.
These outcomes can look almost identical during their first few candles.
That is why treating every breakout as an automatic buying opportunity is a dangerous simplification.
Why Pullbacks Matter
Imagine a cryptocurrency spending several days between $94 and $100.
Eventually, price breaks above $100 and advances toward $104.
Shortly afterward, it begins declining.
For an inexperienced trader, the pullback may look like a warning that the breakout has failed.
But a pullback isn't necessarily bearish.
Markets rarely advance in perfectly straight lines.
Some buyers take profits. Others wait for better entries. Short-term traders reduce exposure.
The important question is where price finds support and how it behaves during the retracement.
If the former resistance area around $100 begins attracting buyers, the market may be demonstrating that participants now perceive the earlier ceiling as an acceptable buying zone.
This is commonly called a resistance-to-support transition.
It can strengthen the interpretation of a breakout, although it never guarantees continuation.
What a Failed Breakout Looks Like
Now consider a different outcome.
Price breaks above $100, briefly reaches $102, and then falls back to $97.
The breakout level fails to hold.
A subsequent recovery attempt struggles below $100.
This behaviour suggests that the initial move did not establish sustained buying control.
The breakout may have been driven by short-term buying, stop orders, temporary liquidity conditions or momentum traders entering at the same time.
The exact cause isn't always knowable from a chart.
What matters is that price failed to maintain the new range.
Traders sometimes call this a false breakout or bull trap.
The opposite can occur below support, where an apparent bearish breakdown is quickly reversed.
In both cases, the failure to sustain a move can provide information about market structure.
Volume Helps, but Context Still Matters
Volume is often used to evaluate breakout quality.
A move above resistance accompanied by unusually strong volume may suggest increased participation.
However, large volume alone cannot tell us whether buyers or sellers will ultimately dominate.
A breakout can occur on heavy volume and still reverse sharply if aggressive buying encounters substantial selling interest.
A useful approach is to examine volume alongside the behaviour after the breakout.
Does price maintain its gains?
Does a pullback occur on relatively lighter activity?
Does renewed buying appear as price approaches the former resistance level?
Is the broader market supporting or opposing the move?
These observations help develop a fuller picture.
They should not be interpreted as a mechanical guarantee.
Timeframes Can Tell Different Stories
Another complication is timeframe selection.
A breakout visible on a five-minute chart may represent nothing more than a small fluctuation inside a much larger hourly trading range.
For example, an asset could break above short-term resistance at $100 while the four-hour chart still shows substantial resistance near $103.
A trader focused exclusively on the five-minute chart may see a major bullish event.
A trader examining the higher timeframe may see price approaching a significant selling zone.
Both observations can be technically correct.
The difference is context.
This is why multi-timeframe analysis is valuable, especially when a setup appears unusually attractive on a very short timeframe.
Three Questions Before Acting on a Breakout
Rather than entering simply because price crossed a line, consider three questions.
First, what exactly has changed?
Has the market broken a meaningful structural level, or just a minor intraday boundary?
Second, is the move being accepted?
Is price holding above the previous range, or returning immediately to where it started?
Third, where is the trade invalidated?
If the breakout fails, is there a logical price at which the original trading idea no longer makes sense?
These questions encourage analysis based on market behaviour rather than excitement.
The Best Entry Isn't Always the Earliest
Many traders feel compelled to enter the instant a breakout occurs.
Sometimes early participation works exceptionally well.
But entering later, after observing how price reacts, can occasionally provide more useful information.
The trade-off is that waiting may result in a worse price—or no entry at all if the market continues without pulling back.
There is no universally superior choice.
The appropriate approach depends on the strategy, timeframe, volatility and risk structure.
TrendScore's emphasis on combining multiple conditions reflects the broader principle that an isolated chart event should rarely be treated as sufficient evidence by itself.
A breakout deserves attention.
The behaviour that follows helps determine whether that attention is justified.