
Why a dramatic wick can be useful evidence without being proof of a reversal.
There's something about a long candlestick wick that instantly attracts attention.
A market plunges, leaves a dramatic lower shadow and closes well above its lowest price.
Within minutes, traders begin discussing a liquidity sweep, institutional buying or a possible reversal.
Elsewhere, an asset rallies aggressively, leaves a long upper wick and retreats.
That candle is quickly described as a rejection.
Sometimes these interpretations turn out to be useful.
But there's an important distinction between what a candlestick actually shows and the story traders attach to it.
A wick is evidence of where price traded.
It isn't a complete explanation of why price went there.
What a Wick Actually Represents
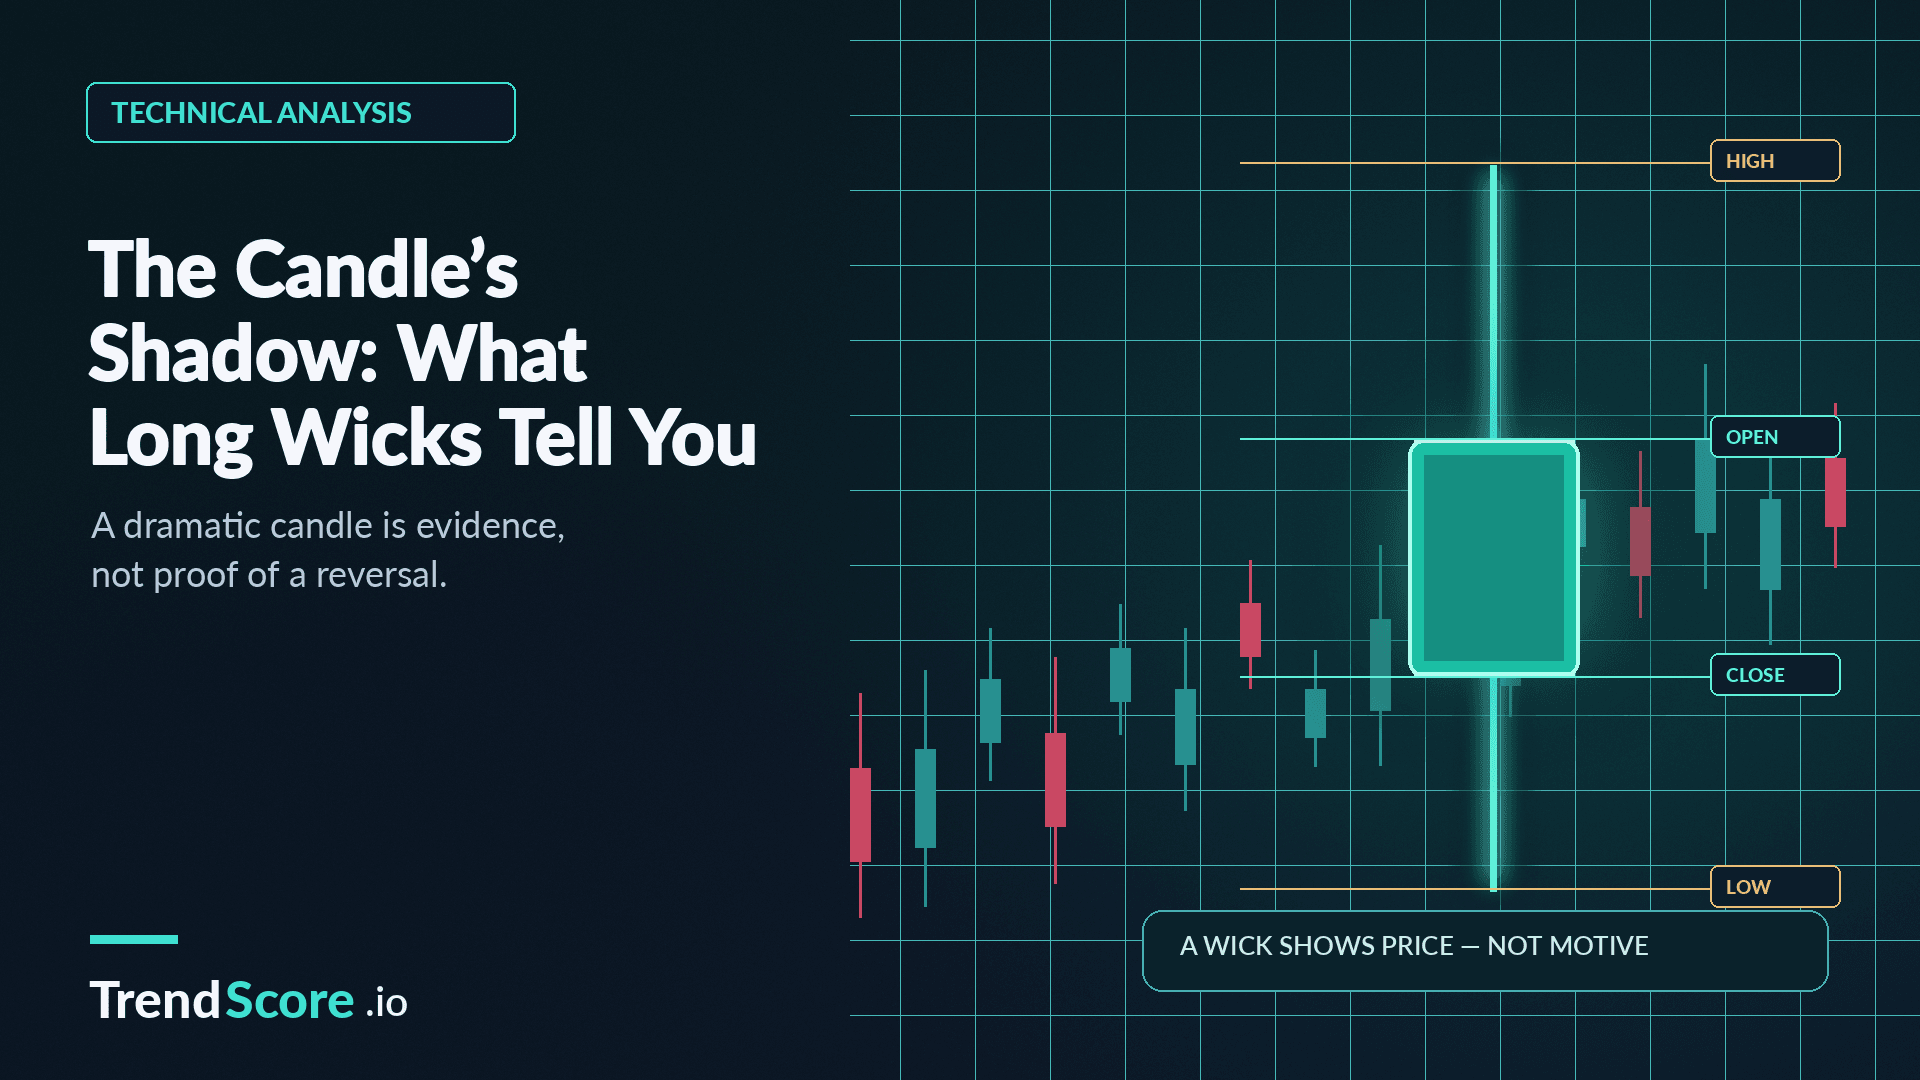
Every standard candlestick contains four basic prices.
The open, high, low and close.
The body shows the relationship between the opening and closing prices.
The upper wick extends to the highest traded price during the period.
The lower wick extends to the lowest.
Suppose a cryptocurrency produces the following fifteen-minute candle:
Open: $100.
High: $101.
Low: $94.
Close: $99.
The long lower wick tells us that price traded as low as $94 but finished the fifteen-minute interval near $99.
During that period, the market experienced a significant downward excursion followed by a recovery.
That's useful information.
But the candle alone doesn't establish whether the recovery came from aggressive new buying, short covering, reduced selling pressure or some combination of factors.
It also doesn't tell us the precise sequence of every transaction.
Rejection Is an Interpretation, Not a Fact
Traders often use the word "rejection" when price moves beyond a level and then quickly returns.
That's a reasonable descriptive shorthand.
But it can create a misleading sense of certainty.
A long upper wick doesn't necessarily prove that sophisticated market participants deliberately defended a resistance level.
A long lower wick doesn't prove that large institutions accumulated the asset.
Those explanations may be plausible in some circumstances.
They require additional evidence.
A candlestick summarizes price behaviour.
It doesn't identify who traded, why they traded or whether their activity will continue.
Location Changes Everything
Imagine two identical long lower wicks.
The first appears after a sustained decline, directly around a previously established support area.
The second appears in the middle of an ordinary sideways range with no particularly meaningful structural level nearby.
The shape of the candles is the same.
Their context is not.
In the first situation, the wick may deserve closer attention because it coincides with an area where market participants previously demonstrated buying interest.
In the second, it may simply represent normal intraday fluctuation.
This is why candle patterns should be interpreted within broader market structure.
The location of the wick often matters more than its appearance.
A Wick Can Also Reveal Poor Liquidity
Not every dramatic shadow represents an important battle between buyers and sellers.
Sometimes it reflects a market with relatively thin order-book depth.
Imagine a small cryptocurrency trading near $1.
A large market sell order arrives when there are relatively few resting bids.
Price drops rapidly to $0.92 before recovering to $0.99 as additional liquidity becomes available.
The chart displays a spectacular lower wick.
But the movement might have been driven partly by temporary execution conditions rather than a meaningful change in investor expectations.
This is particularly relevant when comparing wicks across different exchanges.
One venue may experience a brief dislocation that is less visible elsewhere.
Before assigning deep significance to an unusual wick, it can be useful to examine liquidity, trading volume and whether similar movements occurred across other venues.
Why the Close Matters
One reason traders examine candle closes is that the closing price provides information about where the market finished the observation period.
A lower wick that recovers and closes above a meaningful support level may suggest that the breakdown was not sustained.
A candle that moves below support and closes near its low provides a different picture.
But even closes must be interpreted carefully.
A five-minute candle could recover strongly while the hourly candle still shows substantial weakness.
The timeframe changes the context.
And the close of a candle is not a permanent settlement of the market's direction.
The next candle can undo the entire move.
The Next Reaction Can Be More Important Than the Wick
Suppose a cryptocurrency produces a long lower wick near support.
What happens afterward?
Does the next candle maintain the recovery?
Does price establish a higher low?
Does buying activity persist?
Or does the market immediately return to the same level and break through it?
These subsequent observations help determine whether the wick marked a meaningful change in behaviour or merely a temporary interruption.
This is why using the wick as a starting point for investigation is more sensible than treating it as a complete trading signal.
Don't Turn Every Wick Into a Market-Manipulation Story
Crypto traders frequently attribute sudden price movements to stop hunting or deliberate manipulation.
Market manipulation can occur, and order concentrations around obvious levels can influence short-term movements.
But a dramatic wick does not by itself prove manipulation.
Stop orders, liquidations, aggressive market orders and rapid changes in liquidity can produce similar chart patterns without demonstrating a coordinated attempt to move prices.
The explanation should not be more confident than the evidence.
This is especially important when discussing smaller cryptocurrencies, where ordinary order-book imbalances can create extreme-looking candles.
What Traders Can Actually Use
A long wick can help identify an area worth investigating.
It may indicate a failed attempt to sustain prices beyond an important level.
It may reveal unusual short-term volatility.
It may help define the boundary of a potential setup.
But its usefulness depends on confirmation, liquidity conditions, timeframe and the risk required to participate.
At TrendScore, examining candlestick behaviour alongside broader structural and momentum conditions is more meaningful than treating any single candle shape as a guarantee.
The important question isn't whether a wick looks impressive.
It's whether the surrounding market evidence supports a coherent trading decision.
A wick tells you where price travelled and where it finished. The story behind that movement still needs to be investigated.