
Why sample size changes what trading statistics can reasonably tell us.
A cryptocurrency trader posts a screenshot.
Eight winning trades.
Two losing trades.
An 80% win rate.
The results look excellent, and the comments begin arriving.
"What's your strategy?"
"How do I copy these signals?"
"Finally, a system that actually works."
The numbers may be completely accurate.
Eight out of ten is indeed 80%.
But there's a problem with interpreting that result as evidence of a reliable trading method.
Ten trades tell you what happened ten times. They don't necessarily tell you what is likely to happen over the next thousand.
This is where sample size becomes one of the most overlooked subjects in trading research.
An Impressive Percentage Can Hide Very Little Evidence
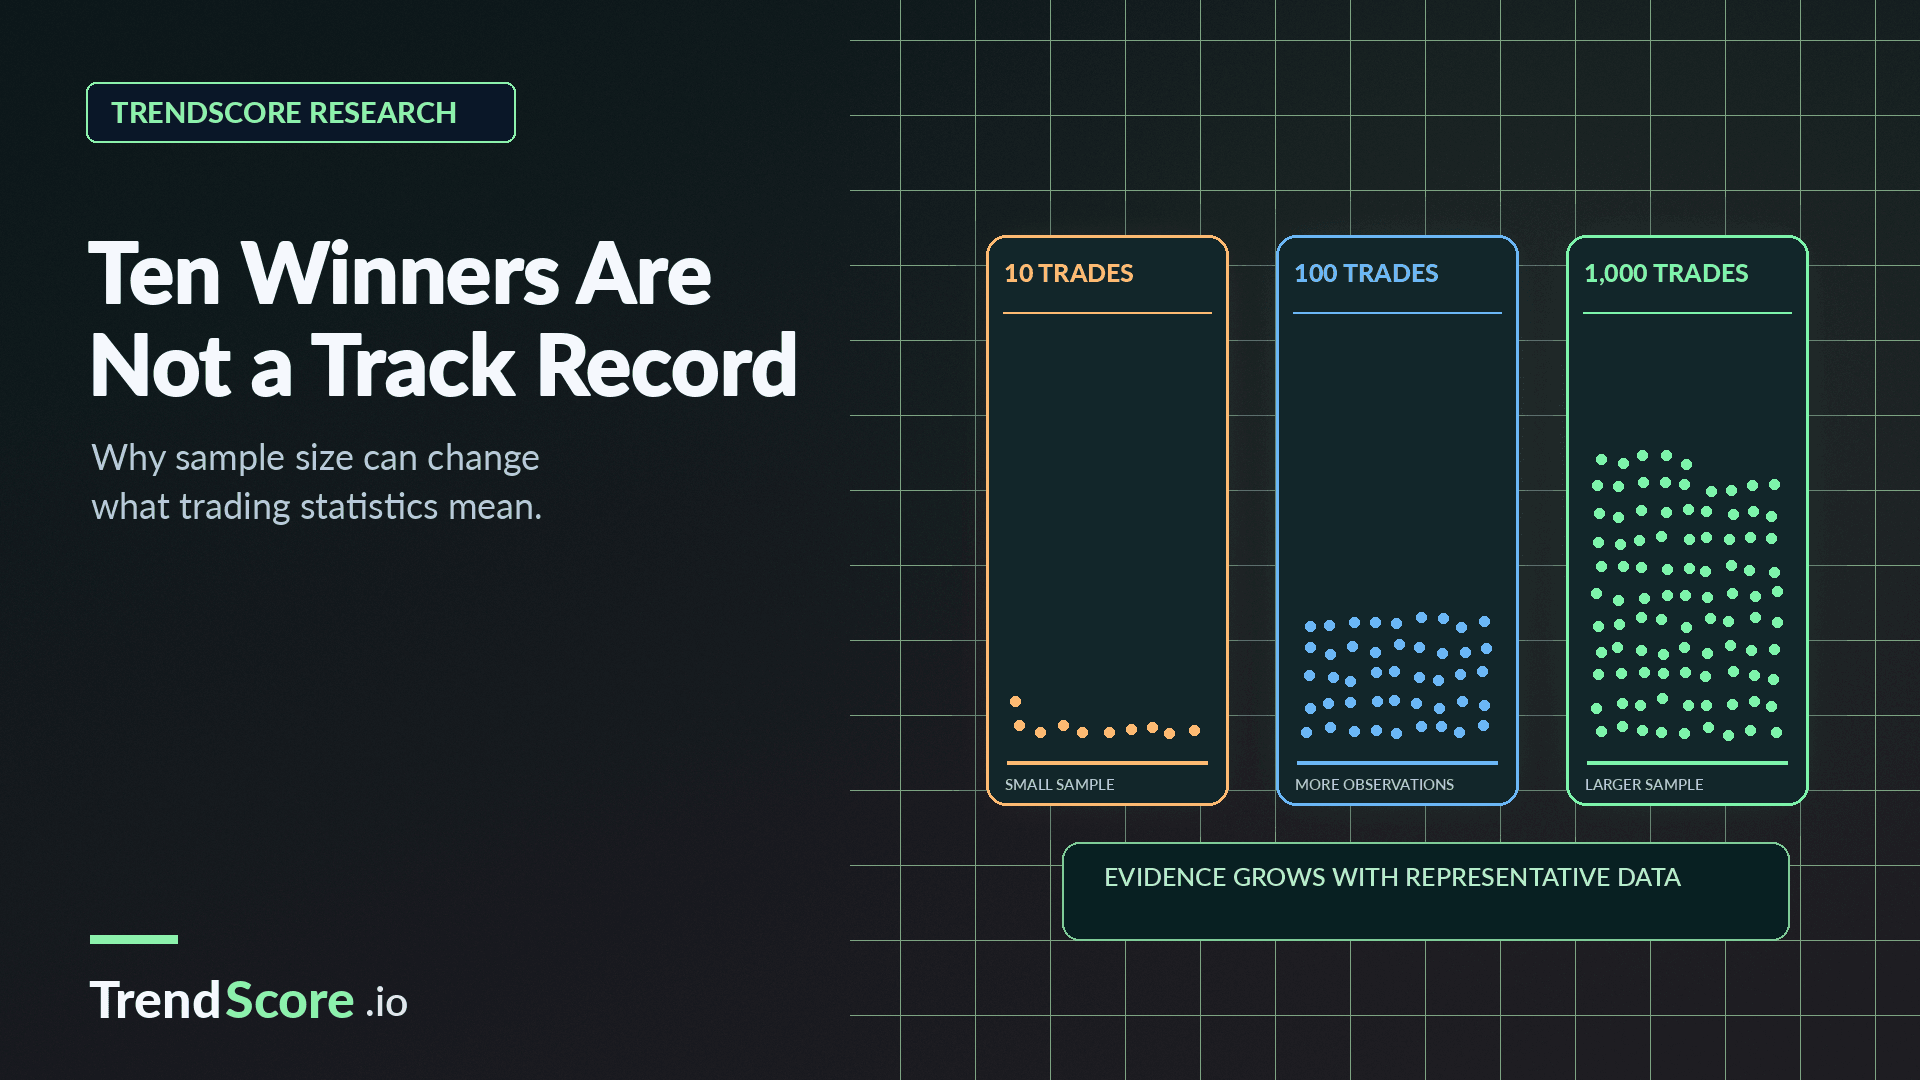
Consider three hypothetical strategies.
Strategy A has completed ten trades and won eight.
Strategy B has completed 100 trades and won eighty.
Strategy C has completed 1,000 trades and won eight hundred.
All three show an 80% historical win rate.
But the evidence behind those percentages is very different.
The first strategy could have experienced a favourable short-term streak.
The second has been observed more extensively.
The third provides a substantially larger record.
Assuming observations are representative and not excessively dependent on one another, larger samples generally allow more precise estimates of underlying performance.
That doesn't mean Strategy C is automatically better or profitable.
It means there is more information available for evaluating its reported win rate.
Why Small Samples Are Unstable
Suppose a system begins with eight wins and two losses.
Its win rate is 80%.
Now the next five trades all lose.
The record becomes eight wins out of fifteen trades.
The win rate falls to approximately 53%.
The strategy's displayed performance has changed dramatically.
But did its underlying quality suddenly deteriorate?
Possibly.
Or perhaps the original ten trades were simply too few to provide a dependable estimate.
With small samples, individual outcomes can cause large changes in the reported statistics.
As the sample grows, each additional result typically has less influence on the overall percentage.
This is why early performance should be interpreted with caution.
The Market Environment Matters as Much as the Count
Even a large sample can be misleading if all the observations come from similar conditions.
Imagine a strategy tested over 500 trades during one sustained bull market.
The results might look consistent.
But what happens when Bitcoin enters a prolonged decline?
What happens during sideways trading, when breakouts frequently fail?
Or during periods of rapidly expanding volatility?
A large number of trades drawn from one favourable environment doesn't automatically establish that a methodology will perform well elsewhere.
A meaningful test should examine different market regimes and avoid relying entirely on one unusually supportive period.
For systematic trading platforms, this distinction is essential.
The goal isn't merely collecting more trades.
It's collecting evidence that reflects the conditions under which the methodology is expected to operate.
A Thousand Trades May Not Be a Thousand Independent Observations
Here's a less obvious problem.
Imagine a scanner produces twenty LONG setups within five minutes.
Most involve altcoins responding to the same sudden Bitcoin rally.
Eighteen of them reach their first profit targets.
The reported success rate looks extraordinary.
But those twenty outcomes may be strongly dependent on the same underlying market event.
They are not necessarily twenty independent pieces of evidence about the scanner's predictive ability.
If Bitcoin had reversed sharply, many might have failed together.
This dependence matters when estimating uncertainty.
Statistical calculations that assume independent observations can produce misleadingly narrow confidence estimates when trade outcomes are highly correlated.
A robust research approach should consider clustering by time, market event, asset and prevailing regime.
The number of trades matters.
So does how those trades are related.
Win Rate Isn't the Same as Profitability
Sample size also doesn't solve another familiar problem.
A strategy can have a high win rate and still lose money.
Suppose a hypothetical strategy wins 80% of its trades.
Each winner earns $10.
Each loser costs $50.
Across 100 trades, the expected result would be:
80 wins × $10 = $800.
20 losses × $50 = $1,000.
Net result: −$200 before trading costs.
The win rate looks impressive.
The economics do not.
This is why profitability studies need to examine average gains, average losses, drawdowns, fees, slippage and the size of individual positions.
A win rate without those details is an incomplete performance statistic.
Scoring Systems Need Calibration
The same principles apply to systems that rank trading opportunities.
Imagine a scanner assigns scores between 0 and 500.
Higher scores are intended to indicate stronger alignment with the system's analytical conditions.
One useful research question is whether higher-scoring setups actually produce better outcomes on previously unseen data.
To investigate, the researcher might group scenarios into score ranges.
For example:
200–249.
250–299.
300–349.
350–399.
400 and above.
Then evaluate the outcomes within each group.
But the number of observations matters.
If the highest group contains only six scenarios, a 100% historical success rate would not establish a reliable probability of future success.
And even a larger group needs careful interpretation if the examples were drawn from closely related market conditions.
A numerical ranking is meaningful because of its defined methodology.
Its relationship to future outcomes must be demonstrated rather than assumed.
Avoid Changing the Rules After Seeing the Results
Another research problem occurs when strategies are adjusted repeatedly using the same dataset.
A developer tries one indicator threshold.
The results look average.
They increase the threshold.
Performance improves.
They change the timeframe.
Performance improves again.
After many revisions, the historical record looks exceptional.
But the improved results may reflect adaptation to the particular dataset rather than discovery of a reliable relationship.
This is known as overfitting.
A better evaluation separates the information used to design a strategy from the information used to assess it.
The testing process should also account for the number of alternative configurations examined.
When enough variations are tried, some may appear unusually successful by chance.
Make the Full Record Visible
For TrendScore Research, the most valuable long-term objective is not publishing the highest win rate possible.
It's building a credible record of how different analytical scenarios behave.
That means distinguishing between generated signals, opportunities that never reached their entry prices and simulated positions that were actually opened.
It means recording losses as consistently as wins.
And it means evaluating results across assets, timeframes and market conditions rather than combining everything into one headline number.
This type of reporting may be less dramatic than publishing a screenshot of ten consecutive successful trades.
But it gives users considerably more useful information.
The purpose of research isn't to make a system look impressive.
It's to discover what the evidence can genuinely support.
Trust the Record, Not the Headline
An 80% win rate sounds powerful.
Sometimes it may reflect a strategy with a genuine advantage.
Other times, it may be the result of a small sample, favourable conditions, correlated outcomes or selective reporting.
The percentage alone cannot distinguish between those possibilities.
We need to know how many trades were observed, how they were selected, how independent they were and what happened financially when they won or lost.
Only then does the performance statistic begin to tell a meaningful story.
A successful trade is an observation. A collection of successful trades is a dataset. A reliable conclusion requires knowing whether that dataset is large enough, representative enough and honestly measured.