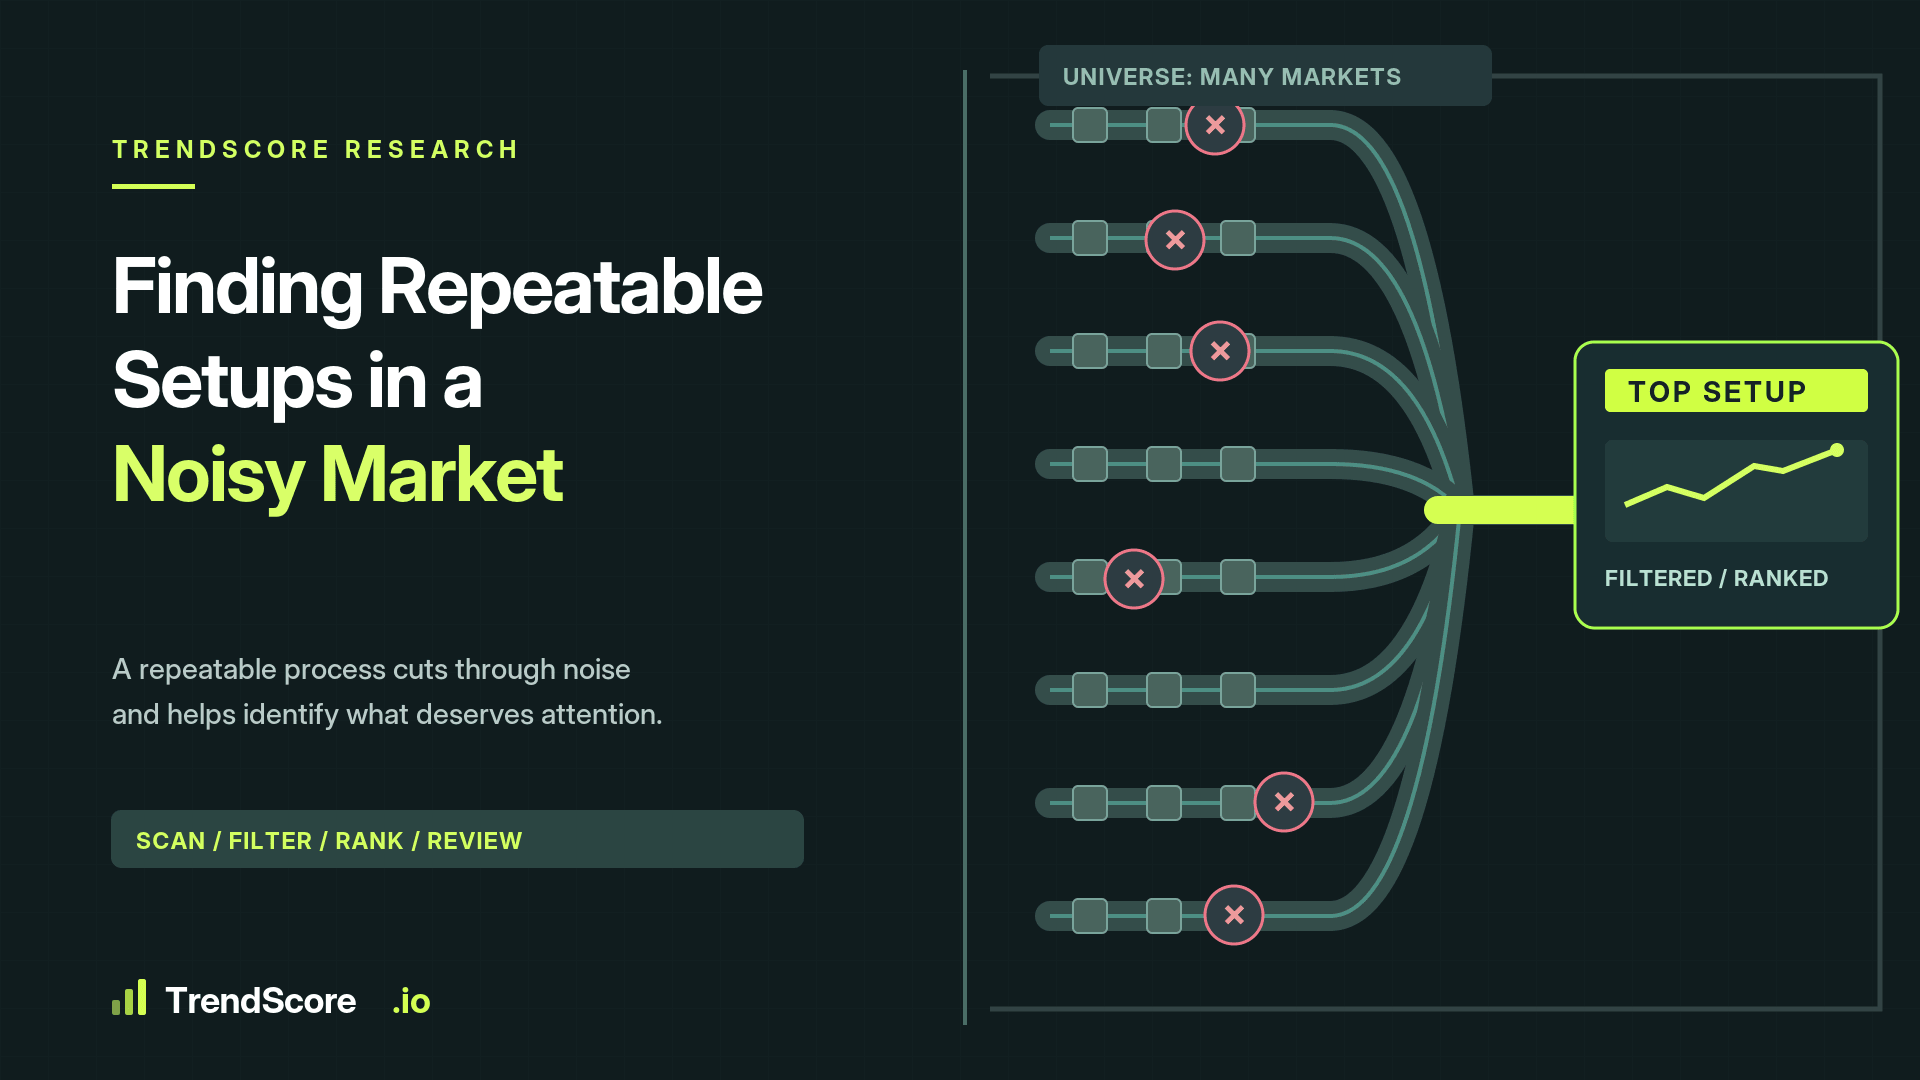


How quiet, repeatable market conditions can be more useful than spectacular short-term movements.
The cryptocurrency market is extremely good at attracting attention.
A token rises 18% in forty minutes.
Another collapses after an unexpected announcement.
A heavily leveraged position produces a spectacular return, and the screenshot begins circulating across social media.
These events are exciting.
They are also relatively easy to notice.
The harder task is identifying trading opportunities before they become exciting—and determining whether the conditions offer a meaningful analytical advantage.
Sometimes the most interesting setups are the ones nobody is discussing.
They develop quietly, without enormous candles or dramatic headlines.
And that raises an important question:
Does a market need to be exciting to offer an attractive trading opportunity?
Not necessarily.
Excitement and Opportunity Are Different Things
Consider two hypothetical cryptocurrencies.
The first has increased 14% over the past hour.
Volume has exploded, volatility has expanded sharply and social media interest is accelerating.
The second has spent several hours consolidating within a relatively narrow range.
Its trend remains identifiable, momentum is gradually improving and price has established a recognizable area of support.
Which offers the better trade?
There isn't enough information to know.
The first asset may continue moving aggressively.
The second may remain stagnant or break in the wrong direction.
But the comparison illustrates a common analytical mistake.
Traders naturally gravitate toward whichever chart appears most dramatic.
That doesn't mean the dramatic chart offers the best relationship between potential reward and risk.
Why Quiet Conditions Can Be Interesting
Periods of consolidation can provide useful information.
When an asset trades within a relatively stable range, market participants may be establishing a temporary balance between buying and selling pressure.
If price repeatedly tests resistance while maintaining progressively higher lows, for example, that pattern may indicate that buyers are becoming more willing to support the asset at higher prices.
Alternatively, repeated failures near resistance may suggest continued selling pressure.
The important point is that consolidation provides observable structure.
Traders can identify boundaries, measure volatility and evaluate what would constitute a meaningful change in behaviour.
This may be easier than attempting to enter an asset that has already experienced an unusually large move.
A quiet market is not automatically a good market.
But quiet conditions can make the relationship between structure and risk easier to examine.
The Advantage of Defining Risk Before Movement
Suppose a hypothetical asset trades near $50.
It has spent several hours consolidating between $49 and $51.
A trader identifies a potential bullish scenario that would become invalid if price breaks and sustains trading below $48.50.
The analysis provides a framework for evaluating whether an entry near the trading range is attractive.
Now imagine the same asset suddenly rises to $56.
The directional outlook might still be bullish.
But the economics of entering at $56 could be significantly less attractive.
The logical invalidation level may remain much lower, meaning the trader must accept a wider stop or reduce position size.
This is one reason chasing established momentum can create problems.
A correct directional prediction does not automatically produce an attractive entry.
Sometimes the most useful moment for studying a setup occurs before the market makes its most visible movement.
Systematic Research Reduces Attention Bias
Human traders naturally notice unusual events.
Large price movements attract attention because they stand out visually.
The problem is that attention and opportunity are not equivalent.
A systematic scanner can approach the market differently.
Instead of asking which asset has produced the most dramatic candle, it can evaluate an entire universe of markets according to predefined conditions.
Depending on the methodology, those conditions might include:
Directional trend and structural alignment.
Momentum strength and recent changes.
Volatility relative to the asset's historical behaviour.
Liquidity and trading activity.
The relationship between potential reward and risk.
The purpose is to identify candidates that deserve closer investigation.
This approach doesn't guarantee that quieter assets will outperform more volatile ones.
It simply reduces dependence on whatever happens to attract human attention.
Why Repeatability Matters More Than a Single Spectacular Trade
Imagine a trader who earns $500 from one exceptional market movement.
That's a positive financial result.
But what does it tell us about the underlying strategy?
Very little.
Was the entry based on a defined method?
Could the setup have been identified consistently?
Was the risk controlled?
Would similar decisions produce reasonable outcomes over a much larger sample?
Without answers, the result is difficult to evaluate.
Now consider a methodology that identifies comparable conditions repeatedly over several months.
Some positions win.
Some lose.
The results can be measured, compared and examined across different market environments.
That creates a foundation for actual research.
The most useful trading systems are not necessarily the ones producing the most impressive individual screenshots.
They are the ones whose behaviour can be evaluated consistently.
The Problem With Beautiful Historical Charts
There is an important danger here.
Once we know how a market moved, it becomes surprisingly easy to identify patterns that appear to have predicted the result.
A researcher might notice that several successful trades shared similar indicator readings.
They then adjust the rules until the historical results look exceptional.
Unfortunately, the strategy may simply have been fitted to past market behaviour.
This is known as overfitting.
A methodology that performs extremely well on the data used to construct it may behave poorly when exposed to previously unseen conditions.
Proper research should therefore distinguish between developing rules and independently testing them.
The results should also account for execution assumptions, transaction costs and the possibility that market conditions may change.
A strategy deserves confidence because it survives meaningful evaluation—not because its best historical trades look convincing.
Why Paper Trading Is Useful for Research
Simulated trading provides an environment where strategies can be observed without immediately risking real money.
This is particularly valuable for examining whether a system follows its intended rules.
Did the setup appear before the price movement?
Was the entry realistically available?
Were profit targets and stops defined beforehand?
How did the simulated portfolio behave during consecutive losses?
These questions help establish whether the methodology is internally consistent.
However, simulated results have important limitations.
Real-world execution can introduce slippage, fees, funding costs, liquidity constraints and emotional responses that are not fully represented in a paper-trading environment.
Paper trading is best understood as a research and learning tool, not proof of future real-money performance.
What TrendScore Can Contribute
TrendScore's approach to scanning and structured market scenarios provides a framework for examining opportunities more systematically.
Rather than relying entirely on manual chart selection, users can review ranked analytical candidates, examine Entry, Take Profit and Stop Loss levels, and observe simulated trading outcomes.
The longer-term research opportunity lies in studying patterns across a meaningful collection of recorded scenarios.
For example, researchers could investigate whether certain types of setups perform differently during strong trends compared with sideways markets.
They could examine whether unusually high volatility affects simulated stop-loss frequency.
Or they could explore how trade outcomes vary across different timeframes and risk-to-reward configurations.
Those are research questions—not established findings. Reliable conclusions would require sufficient data, careful testing and transparent reporting.
That distinction matters because good research should be comfortable admitting what it has not yet demonstrated.
Good Research Is Often Unexciting
Serious market research involves a great deal of ordinary work.
Recording data.
Comparing outcomes.
Testing assumptions.
Reviewing failures.
Revising rules when the evidence justifies it.
None of this is particularly dramatic.
But it is how a trading methodology becomes more understandable and measurable.
The same principle applies to the setups themselves.
An orderly consolidation with clearly defined risk may deserve more research attention than a spectacular price spike with no sensible entry.
That doesn't mean the quiet trade will necessarily win.
It means there may be a better foundation for evaluating it.
In a market where attention constantly shifts toward the newest and loudest movement, the ability to examine ordinary conditions carefully is valuable.
The real advantage of systematic research is not discovering which chart looks most exciting. It is learning which conditions are worth studying, how to measure them and when the evidence is strong enough to justify taking a risk.