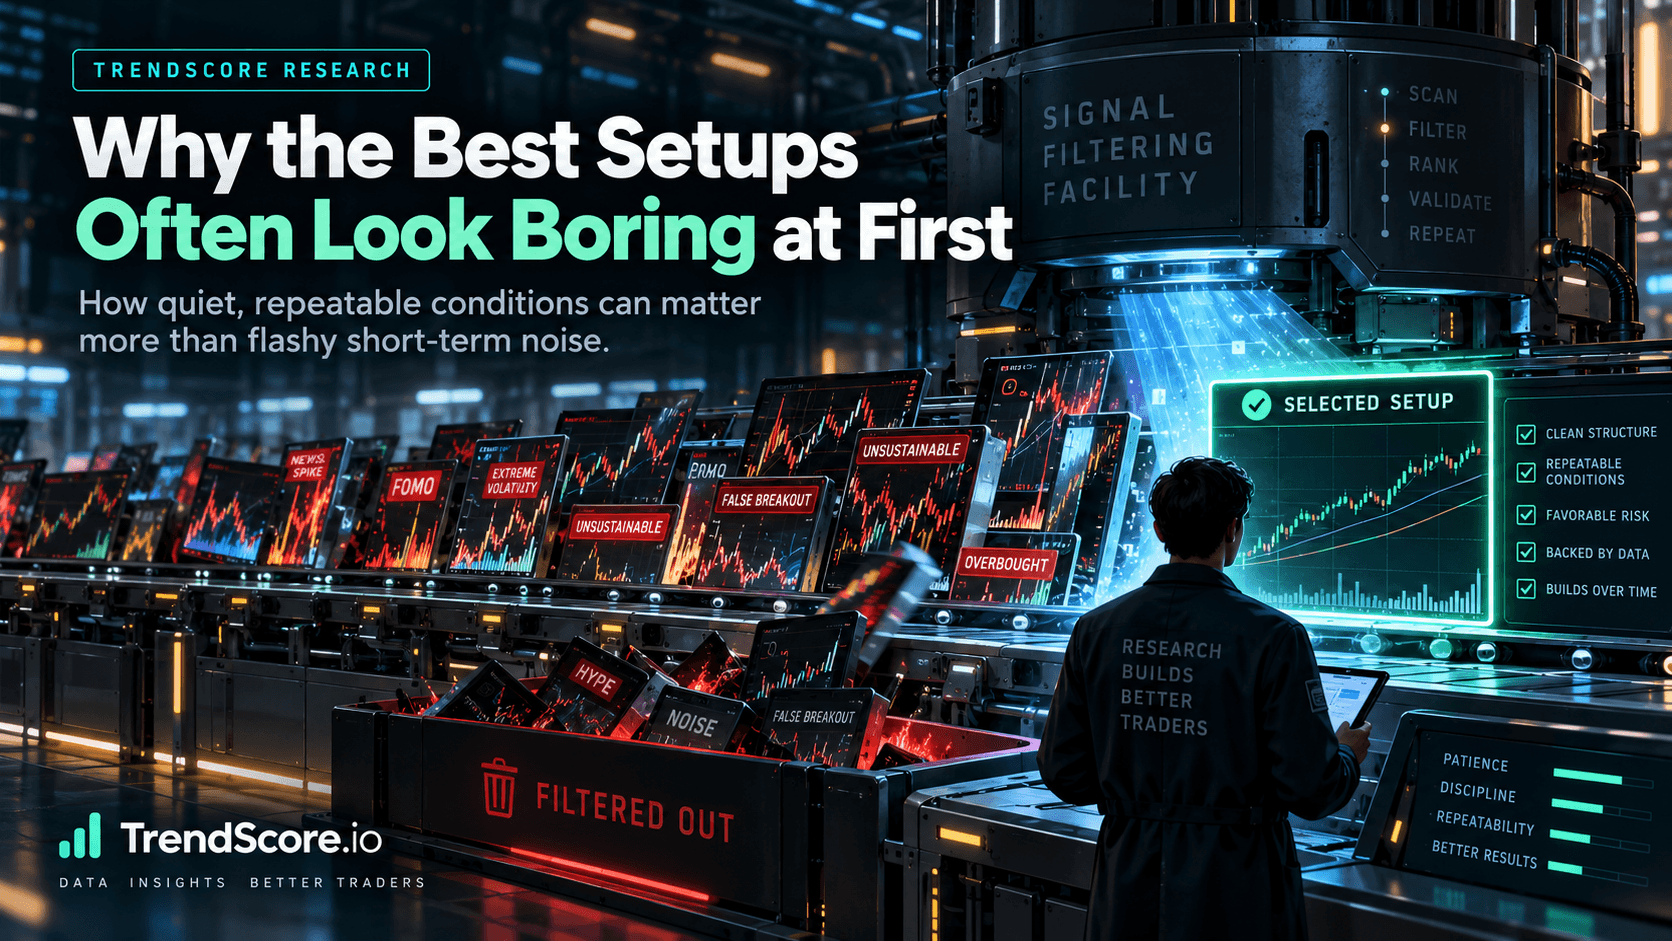

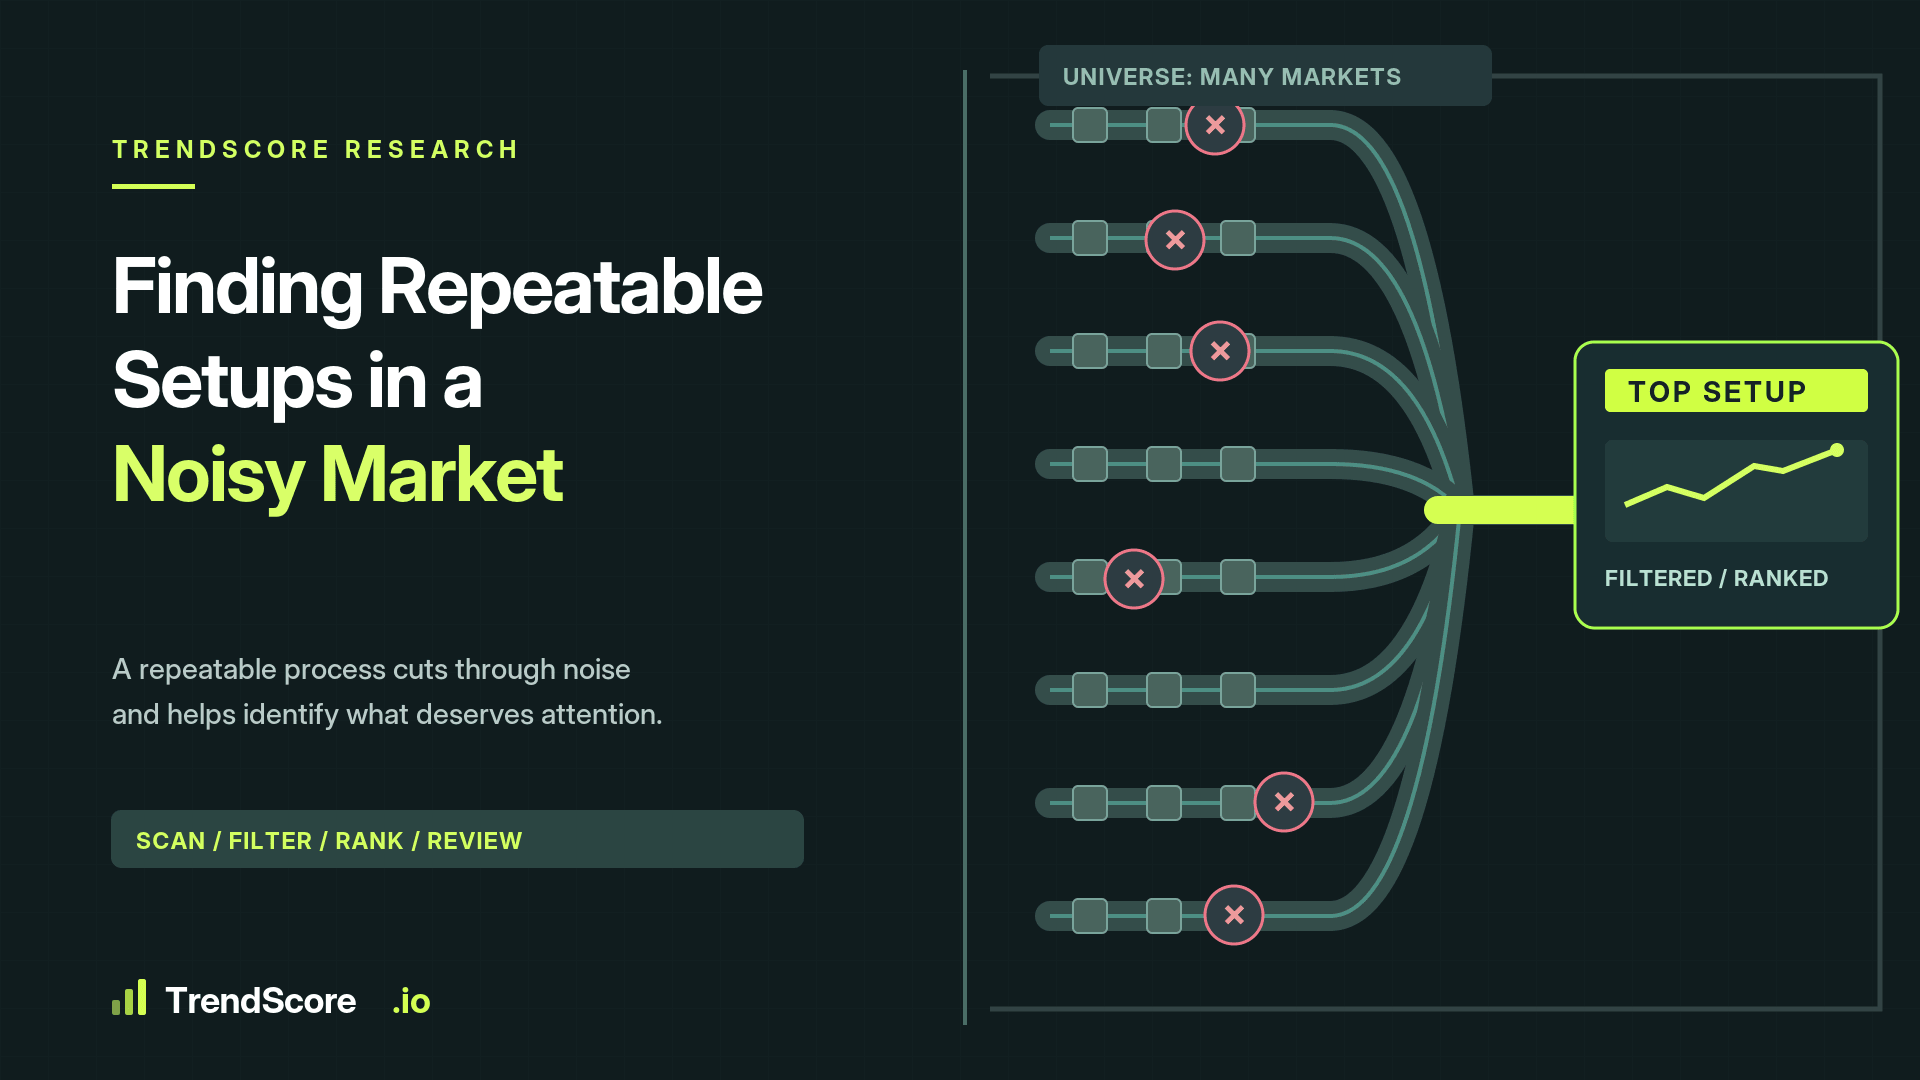
Why filtering, ranking and consistency matter more than watching everything at once.
The cryptocurrency market generates an almost absurd amount of information.
Hundreds of trading pairs move simultaneously.
Indicators change across multiple timeframes.
Volume expands and contracts.
Funding rates shift.
Bitcoin influences the direction of other assets, while individual cryptocurrencies react to news, liquidity changes and sudden bursts of speculation.
For a human trader, trying to absorb everything is practically impossible.
But there's a more interesting problem.
Even if you could watch every chart, would that actually make your decisions better?
Not necessarily.
More information can help, but only when there's a useful method for deciding which information matters.
This is where systematic market research becomes valuable.
The Difference Between Watching and Measuring
Imagine two traders monitoring the same group of 200 cryptocurrencies.
The first moves between charts, looking for patterns that seem familiar.
They notice a breakout here, an oversold RSI there and a sharp increase in volume somewhere else.
Their decisions depend heavily on what happens to attract their attention.
The second trader begins with predefined conditions.
They measure trend, momentum, volatility and other relevant characteristics consistently across the same assets.
The results are ranked according to a documented framework.
Only the most relevant candidates receive further analysis.
Neither approach guarantees better performance.
But the second creates something particularly useful: a repeatable process.
It becomes possible to review which conditions produced attractive outcomes and which repeatedly failed.
Without consistency, meaningful evaluation is much harder.
A Good Scanner Should Be Selective
One common assumption about automated trading technology is that discovering more opportunities must be better.
But consider a hypothetical scanner that identifies 150 potential trades every day.
If most of those setups are weak, conflicting or unsuitable for the current market environment, the scanner may create more confusion than value.
The trader still has to separate the useful opportunities from the noise.
Now imagine another system identifying only a handful of particularly relevant candidates.
If those candidates are ranked using meaningful and consistently applied criteria, the information may be considerably easier to work with.
The real value isn't the number of signals generated.
It's whether the filtering process helps identify opportunities worth investigating.
Not Every Market Condition Deserves the Same Strategy
A challenge in systematic trading research is that market behaviour changes.
A momentum-based approach may perform well when prices are trending strongly.
The same rules can struggle when markets move sideways and repeatedly reverse.
A breakout strategy might benefit from expanding volatility.
But excessively unstable conditions can also create false breakouts, slippage and poor execution.
This is why evaluating market regime matters.
A useful research framework might distinguish between:
Strong directional trends.
Low-volatility consolidation.
Expanding volatility.
Choppy, directionless trading.
Periods of unusually high correlation across assets.
The objective is not to predict every regime change perfectly.
It is to recognize that a trading method's effectiveness may depend heavily on the environment in which it operates.
A setup that deserves attention today may be much less attractive under different conditions tomorrow.
The Research Trap: Finding Patterns That Only Worked Yesterday
Historical data is incredibly useful.
It's also surprisingly easy to misuse.
Suppose someone reviews two years of market data and discovers that a particular combination of indicators would have produced excellent returns.
They adjust the RSI threshold.
Then the moving-average periods.
Then the volume requirements.
Eventually, the historical results look almost perfect.
Unfortunately, the strategy may have become tailored to the exact market movements that were used to create it.
This is known as overfitting.
Instead of discovering a broadly useful relationship, the researcher may have built a system that explains past price movements exceptionally well but offers little predictive value going forward.
The more parameters a strategy contains, the greater this danger can become.
A sensible evaluation process should therefore separate strategy development from testing on previously unseen data.
Why Paper Trading Deserves More Respect
Paper trading is sometimes dismissed because no real money is involved.
That criticism misses an important benefit.
A simulated trading environment allows a methodology to be observed without immediately exposing real capital to experimental decisions.
But the results still need to be interpreted carefully.
A paper-trading system may assume that orders execute at intended prices. Real markets introduce spreads, fees, slippage, liquidity constraints and funding costs.
A simulated stop loss might execute neatly at the planned level while a real stop-market order experiences a worse fill during a sudden move.
Psychology also changes when actual money is involved.
Paper trading is therefore not proof that a strategy will succeed in live conditions.
It is a useful environment for examining whether the rules behave consistently and whether the proposed trade management is coherent.
For TrendScore, where simulated trading and structured position management form part of the user experience, this distinction is particularly relevant.
Measuring More Than the Win Rate
One of the most common mistakes in evaluating a trading system is focusing exclusively on how often it wins.
Imagine two hypothetical strategies, each with 100 completed trades.
Strategy A wins 70 trades but earns an average of $40 per winner while losing $120 per loser.
Strategy B wins only 45 trades but earns $120 per winner while losing $60 per loser.
Before costs, the results are:
Strategy A
70 × $40 − 30 × $120 = −$800
Strategy B
45 × $120 − 55 × $60 = +$2,100
The strategy with the much higher win rate actually loses money.
This example illustrates why research needs to examine the relationship between wins and losses rather than simply counting profitable trades.
Other useful measurements include maximum drawdown, average reward-to-risk, trading frequency, transaction costs and performance across different market conditions.
A high win rate might look impressive in a promotional screenshot.
It doesn't necessarily demonstrate a profitable methodology.
Repeatability Is More Valuable Than a Spectacular Screenshot
A single successful trade tells us very little about the reliability of the process that produced it.
The market contains enough randomness that even poorly designed strategies can occasionally deliver exceptional results.
What becomes interesting is whether similar market conditions continue producing useful opportunities across many observations.
That requires accurate records.
Every analytical scenario should ideally have a timestamp, defined entry conditions, invalidation level, intended targets and eventual outcome.
Unfilled setups should be distinguished from executed trades.
Results should be evaluated without selectively excluding failures.
And changes to the methodology should be documented so that improvements can be separated from hindsight.
This may sound less exciting than forecasting the next cryptocurrency to rise 20%.
But it's how serious research develops.
The Real Purpose of TrendScore Research
TrendScore is built around the idea that market information becomes more useful when it is systematically organized.
Scanning and ranking help narrow the field of potential opportunities.
Structured LONG and SHORT scenarios provide a framework for examining entries, targets and risk.
Simulated trading allows users to observe how those scenarios unfold without requiring real-money participation.
None of these elements should be mistaken for a guarantee of profitable trading.
The value lies in creating a more measurable decision-making process.
Over time, systematic records can help reveal which approaches deserve further testing, which conditions repeatedly cause problems and where the methodology may need improvement.
The goal isn't to find a system that predicts every market movement. It's to build a process that can be tested, questioned, improved and repeated.
And in a market overflowing with noise, that is already a meaningful advantage.