
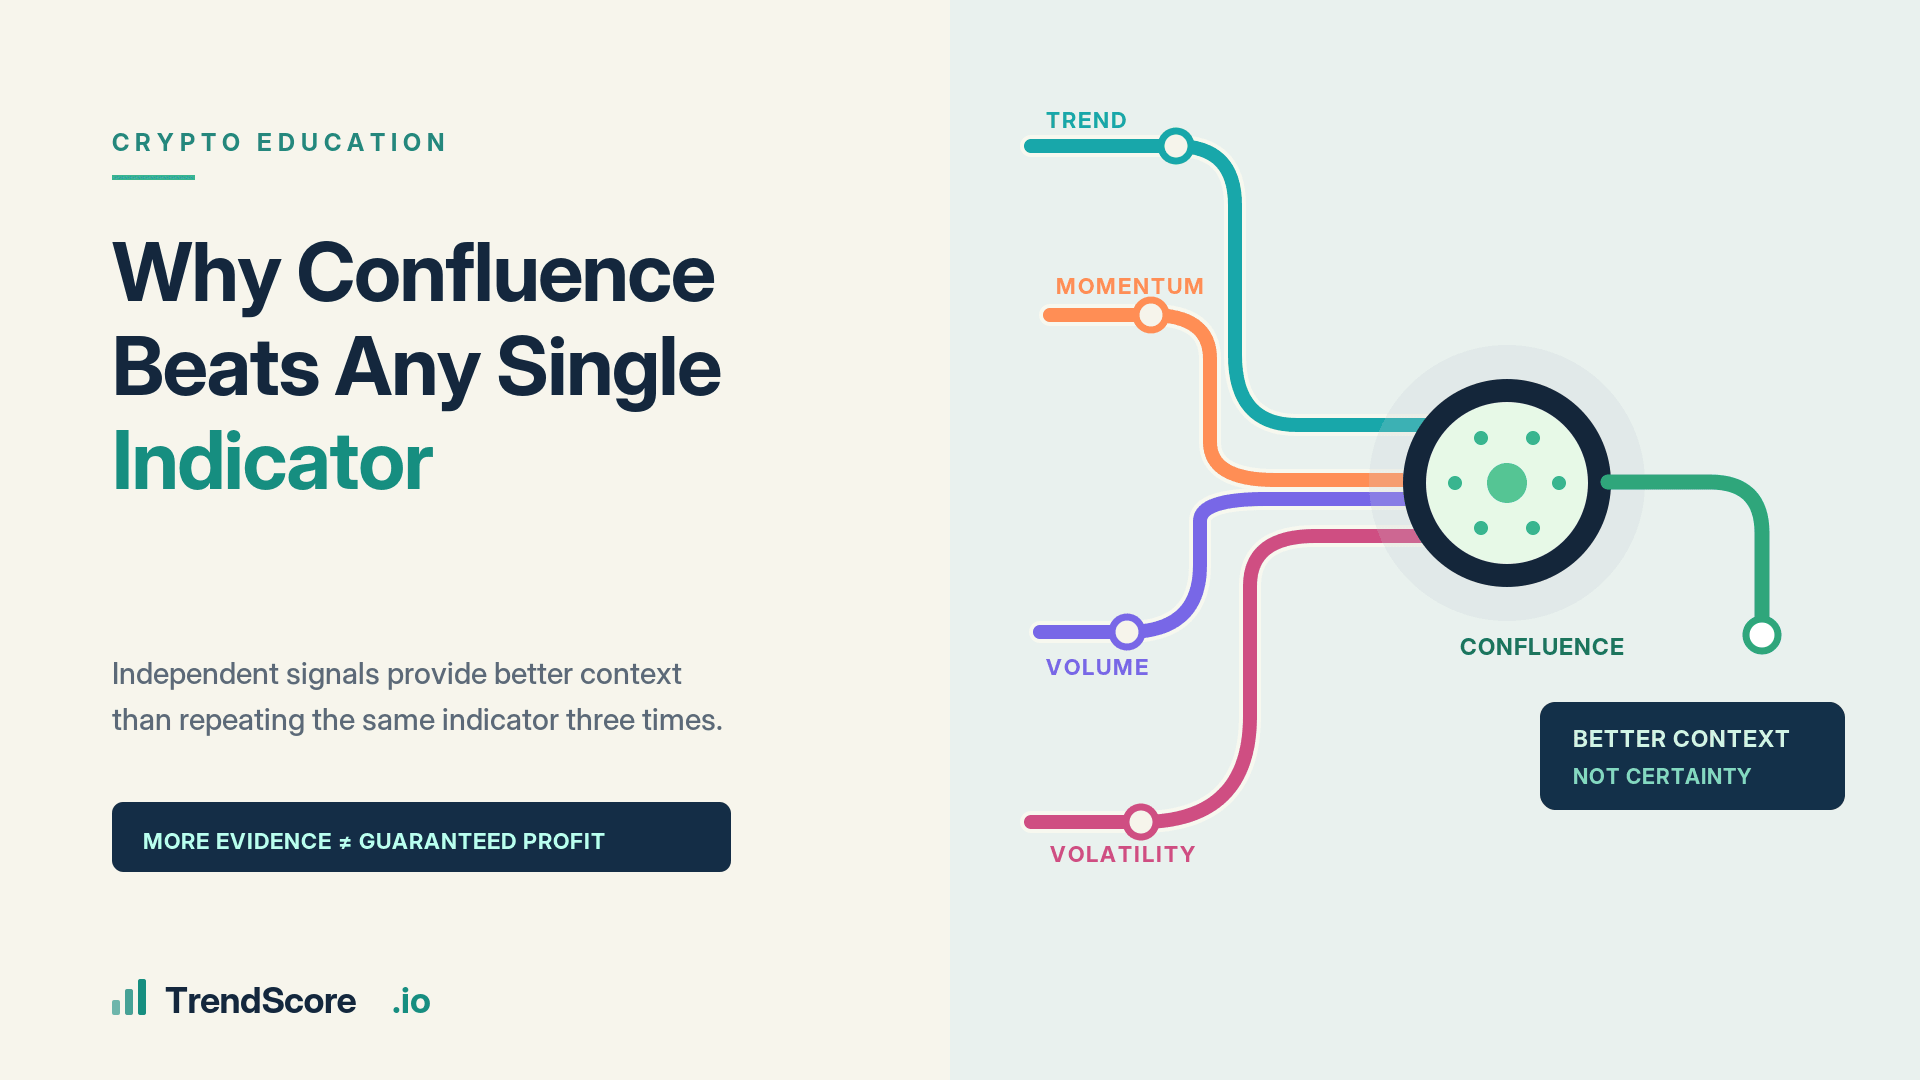
Why stronger decisions usually come from several signals pointing in the same direction.
If you've spent enough time researching trading strategies, you've probably encountered claims about the perfect indicator.
Someone discovers a moving-average combination that supposedly catches every trend.
Another trader believes RSI provides the most reliable reversal signals.
Someone else swears by MACD, Bollinger Bands or a particular Fibonacci level.
The problem is that almost any indicator can look impressive when shown alongside a carefully selected historical chart.
Real markets are much less cooperative.
An indicator that works beautifully during a strong trend may produce repeated false signals when prices move sideways.
The more useful question isn't necessarily which indicator is best.
It's how different pieces of information can work together to describe a trading opportunity.
What Confluence Actually Means
In technical analysis, confluence occurs when several relevant factors support the same interpretation.
Imagine a cryptocurrency showing the following conditions:
The four-hour chart displays a clear upward trend.
Price has pulled back toward a previously established support area.
Momentum is beginning to recover after the pullback.
Trading volume increases as buyers return.
A potential entry allows a clearly defined stop and favourable reward-to-risk ratio.
None of these observations guarantees a successful trade.
But together, they describe a more complete setup than simply noticing that RSI has fallen below 30.
That's the basic value of confluence.
It encourages traders to examine the environment from more than one perspective.
More Indicators Don't Automatically Mean More Confirmation
Here's where things become interesting.
Imagine a trader using RSI, MACD and the stochastic oscillator.
All three indicate bullish momentum.
The trader concludes that three independent signals are confirming the opportunity.
But are they really independent?
Not necessarily.
All three are derived primarily from price behaviour. Although their calculations differ, they can respond to similar underlying changes.
In some situations, the trader is effectively examining the same phenomenon through three different mathematical formulas.
This creates the illusion of stronger confirmation without necessarily adding much new information.
It's a subtle mistake, and one worth understanding.
Three indicators measuring similar behaviour are not the same as three genuinely different sources of evidence.
Think in Terms of Different Questions
A more useful approach is to select analytical tools according to the questions they answer.
For example:
Trend: What is the dominant direction of the market?
Momentum: Is buying or selling pressure strengthening or weakening?
Volatility: How much is price fluctuating, and is that changing?
Volume: How much trading activity accompanies the movement?
Market structure: Where are important support, resistance and invalidation areas?
Risk: Does the potential reward justify the planned exposure?
These dimensions can complement one another.
A strong trend and improving momentum may suggest continuation potential.
But if volatility is expanding unpredictably and the available entry requires an excessively wide stop, the overall trade may still be unattractive.
Confluence isn't simply about counting bullish or bearish indicators.
It's about understanding how different observations interact.
Conflicting Signals Are Useful Information Too
Consider an asset whose daily chart remains bullish while its fifteen-minute chart shows weakening momentum.
Some traders interpret this as a contradiction that needs to be resolved immediately.
But the two observations may be describing different market conditions.
The daily trend could remain healthy while the shorter timeframe experiences a temporary pullback.
Alternatively, weakening lower-timeframe momentum could eventually develop into a larger structural change.
The important point is that conflicting signals don't automatically make the analysis useless.
They can help identify uncertainty.
For a short-term trader, the lower-timeframe weakness may be particularly relevant.
For a longer-term participant, the daily trend could carry more weight.
The interpretation depends on the planned trading horizon.
Why a Strong Signal Can Still Produce a Weak Trade
Suppose five analytical factors all support a bullish position.
The setup appears attractive.
But price has already advanced substantially, and the nearest logical stop sits far below the current market price.
The potential upside is limited compared with the amount at risk.
Even with strong directional confluence, the trade may no longer offer sensible economics.
This is a distinction that gets overlooked when traders become fixated on indicator alignment.
There are really two separate questions:
Does the market environment support this direction?
Can this particular opportunity be traded with acceptable risk?
A convincing answer to the first doesn't guarantee a convincing answer to the second.
Confluence Should Be Tested, Not Assumed
There's another important limitation.
Adding more conditions to a strategy can make its historical results appear better simply because the rules become increasingly selective.
That doesn't necessarily mean the strategy has become more reliable.
If enough indicators and thresholds are adjusted to match past market movements, the resulting system may be overfitted.
It can look excellent historically and perform poorly when conditions change.
Proper evaluation requires testing across different market environments, accounting for trading costs and observing how rules perform on data that wasn't used to design them.
Confluence should improve the quality of information—not become an excuse to build an unnecessarily complicated system.
Better Analysis Is About Agreement and Context
The philosophy behind systematic market scanning is particularly relevant here.
Instead of focusing on an isolated bullish or bearish indicator, traders can examine whether several conditions support the same scenario.
A scoring framework can make this information easier to compare across multiple assets.
However, the value of any score depends on the inputs, their weighting, their historical validation and the market conditions in which they're used.
A higher score should never be confused with a guaranteed outcome or an automatically calibrated probability of success.
At TrendScore, the objective is to help traders examine structured market scenarios rather than rely on a single indicator in isolation.
The broader lesson applies well beyond any particular platform.
A strong trading decision isn't made by finding the loudest signal. It's made by understanding how the available evidence fits together—and where that evidence might be misleading.